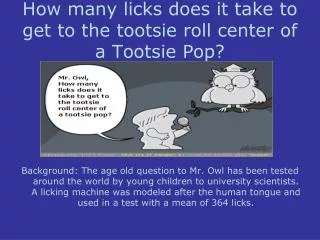
How Many Licks?
How Many Licks?. Taylor Walton Coordinating Seminar. Activity. Determine the rate of change of the volume of a Tootsie Roll Pop as you consume it. Goals: Students will calculate the radius of a sphere. Students will determine the rate of change using collected data. Objectives:

How Many Licks?
E N D
Presentation Transcript
How Many Licks? Taylor Walton Coordinating Seminar
Activity Determine the rate of change of the volume of a Tootsie Roll Pop as you consume it. Goals: • Students will calculate the radius of a sphere. • Students will determine the rate of change using collected data. Objectives: • Given a lollipop and the appropriate materials, students will determine the rate of change of the lollipop’s volume with 90% accuracy.
Materials • Tootsie Roll Pop • String • Ruler • Timer • Graphing Calculator • Paper • Pencil
Step 1 Procedure Measure the initial circumference of your pop: • Wrap the string around the middle of your lollipop • Mark where the measurement is on your string • Lay the string flat on your ruler • Record the measurement
Step 2 • Place the lollipop in your mouth • Start a timer for 30 seconds • Begin to consume the lollipop • Take the lollipop out at the end of the 30 seconds • Repeat step 1 with the new circumference
Step 3 Repeat Steps 1 and 2 until you have collected data for 300 seconds
Step 4 What to do when you get to the center of your lollipop… Using the data you have collected, determine the radius of your lollipop at each time increment
Step 5 Using the data from your table, create a scatter plot of the radii with respect to time (t) Find the Line of Best Fit for your data:
Data Analysis Is your equation reasonable? cm Compared to 1.559 cm from our data ✔ cm Compared to 1.035 cm from our data ✔
Data Analysis How fast does the volume of the Tootsie Roll Pop decrease when the radius is ¼ its original value? Find the rate of change of the volume
Data Analysis How fast does the volume of the Tootsie Roll Pop decrease when the radius is ¼ it’s original value?
Extension How would the rate of change for the volume change if you had a lollipop with a larger radius? What about with a smaller radius? What would happen if the rate of change was larger? How about if it were smaller?
Evaluation • Report throughout the activity • Worksheet
Resources • http://www.finneytown.org/Downloads/Lollipop%20Lab.pdf • http://prezi.com/4r-5nspxuntx/lollipop-lab/