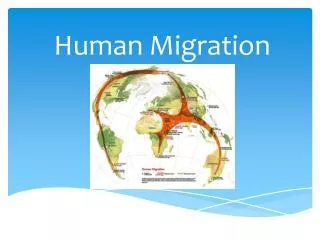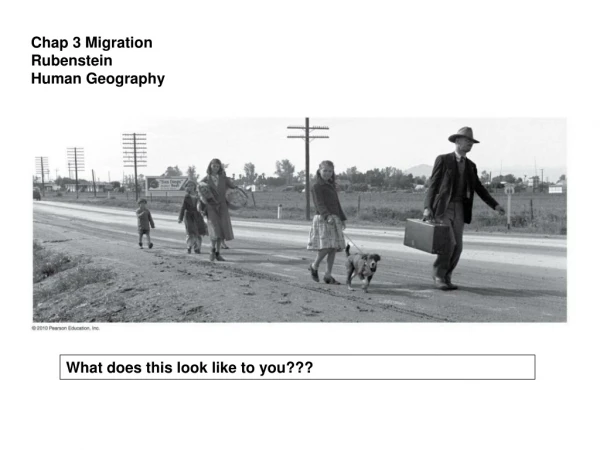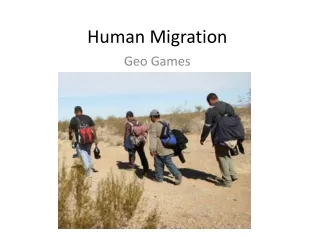
Human Migration
Human Migration. APHG – Spring 2013. Migration. A type of mobility Migration is a permanent move to a new location Migration = relocation diffusion Emigration – number of people leaving a geographic area Immigration – is the number of people entering a geographic area
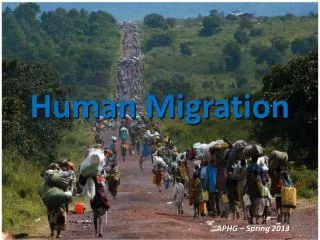

Human Migration
E N D
Presentation Transcript
Human Migration APHG – Spring 2013
Migration • A type of mobility • Migration is a permanent move to a new location • Migration = relocation diffusion • Emigration – number of people leaving a geographic area • Immigration – is the number of people entering a geographic area • Net migration is the difference between the number of people entering a geographic area (immigrants) and those leaving (emigrants) • International Migration: 145 million people lived outside their native countries in the mid – 1990’s, increasing by 2 – 4 million each year http://hdr.undp.org/en/mediacentre/videos/mobility/
Key Issues: Migration • Why do people migrate? • Ravenstein’s Migration Laws • Gravity Model • Where are migrants distributed? • Why do migrants face obstacles? • Why do people migrate within a country?
Why Do People Migrate? • Reasons for Migration • Economic Reasons • Push and pull factors • Economic: People move away from places with poor economic opportunities and toward places with better ones. • Cultural factors • Forced migration (e.g. slavery, refugees) • Political instability • 20th century increased because of political instability resulting from cultural diversity. • Refugees are people who have been forced to migrate from their homes or country and cannot return for fear of persecution • Environmental factors
Why Do People Migrate? • Push and pull factors • Intervening obstacles • Historically, intervening obstacles = environmental • Transportation technology = limited environmental intervening obstacles
Why Do People Migrate? Reasons for migrating • Political conditions – the lure of freedom • Ex. - The election of democratic governments in Eastern Europe during 1990’s, Western Europe’s political pull has disappeared the migration factor. • Other examples? • Environmental • Pulled toward physically attractive regions and pushed from hazardous ones. • Examples?
Refugee A refugee is a person who… owing well founded fear of being persecuted for reasons of race, religion, nationality, membership in a particular social group or political opinion, is outside of the country of his nationality and is unable, or owing to such fear, is unwilling to avail himself to the protection of that country. - United Nations Convention 1977
Refugees: Sources and destinations Major source and destination areas of both international and internal refugees.
Why Do People Migrate? • Distance of migration • Internal migration • Interregional migration = movement from one region to another • Intraregional migration = movement within a region
Why Do People Migrate? • Distance of migration • International migration • Two types • Voluntary • Forced • Migration transition • International migration is most common in countries that are in Stage 2 of the demographic transition.
Global Migration Patterns The major flows of migration are from less developed to more developed countries.
Characteristics of Migrants • Most long distance migrants are • Males - traditionally outnumber females • In the U.S. today, 55% of immigrants = female • Most long distance migrants are • adult individuals • families with children are less common • Family status • In the U.S. today, about 40% of immigrants = young adults, aged 25-39
Ravenstein’s Migration Laws 1.Net migration accounts to a fraction of the gross migration between two places Every migration flow generates a return migration, so the actual migration is the volume of the original flow minus that of the return flow 2. The majority of migrants move a short distance. • Migrants who move longer distances tend to choose big-city destinations. • Urban residents are less migratory than inhabitants of rural areas. • Families are less likely to make international moves that young adults.
Gravity Model • The number of migrants declines as the distance they must travel increases. • The gravity model predicts migration on the basis of the size of population in the respective places and the distance between them. • It states that migration is directly related to the populations and inversely related to the distance between them. • Distance Decay – The diminishing in importance and eventual disappearance of a phenomenon with increasing distance from its origin.
Where Are Migrants Distributed? • Global migration patterns • Regions with Net Out - Migration: Asia, Africa, and Latin America • Regions with Net In - Migration: North America, Europe, and Oceania • The U.S. has the largest foreign-born population
Net Migration by Country Net migration per 1,000 population. The U.S. has the largest number of immigrants, but other developed countries also have relatively large numbers.
Where Are Migrants Distributed? U.S. Migration Patterns • Three main eras of migration • Colonial migration from England and Africa • Nineteenth-century immigration from Europe • Recent immigration from LDCs
Where Are Migrants Distributed? U.S. Migration Patterns • Colonial Immigration from England and Africa Immigration to the American colonies and the newly independent United States came from two sources: Europe and Africa. Most of the Africans were forced to migrate to the United States as slaves, whereas most Europeans were voluntary migrants – although harsh economic conditions and persecution in Europe blurred the distinction between forced and voluntary migration for many Europeans.
Migration to U.S., by region of origin Most migrants to the U.S. were from Europe until the 1960s. Since then, Latin America and Asia have become the main sources of immigrants.
“Looking Backward”: Source –Puck Magazine, January 11, 1893; Joseph Keppler
Where are Migrants Distributed? • Impact of immigration on the United States • Legacy of European migration • Europe’s demographic transition • Stage 2 growth pushed Europeans out • 65 million Europeans emigrate • Diffusion of European culture
Regional Origins of Immigrants to the United States, Selected Years Source: Immigration and Naturalization Service, 1998 Statistical Yearbook
U.S. Migration Patterns Recent Immigration from Less Developed Countries • Immigration to the United States dropped in the 1930’s and 1940’s, during the Great Depression and World War II. Immigration increased steadily during the 50’s – 80’s and 1990’s to historically high levels. • Asia was the leading source of immigrants between the late 1970’s and the late 1980’s until overtaken by Latin America. • About 2 million Latin Americans migrated to the United States 1820 – 1960, about 11 million between 1960 – 2000. The unusually large number of immigrants from Latin America resulted from the 1986 Immigration Reform and Control Act, which issued visas to several hundred thousand who had entered the United States in previous years without legal documents.
Migration from Asia to the U.S. Migration in 2001. The largest numbers of migrants from Asia come from India, China, the Philippines, and Vietnam.
Migration from Latin America to the U.S. Mexico has been the largest source of migrants to the U.S., but migrants have also come from numerous other Latin American nations.
Where Are Migrants Distributed? • Impact of immigration on the United States • Unauthorized immigration • 2008 = estimated 11.9 million unauthorized/undocumented immigrants • About 5.4 percent of the U.S. civilian labor force • Around 59 percent are undocumented immigrants from Mexico http://www.nytimes.com/interactive/2011/07/06/world/americas/immigration.html?pagewanted=print
Undocumented Immigration 1 million & above 10,000- 99,999 100,000 – 999,999 Below 10,000 http://www.nytimes.com/interactive/2011/07/06/world/americas/immigration.html?pagewanted=print
Undocumented Immigration:Mexico to Arizona The complex route of one group of undocumented migrants from a small village north of Mexico City to Phoenix, Arizona.
Destinations of Immigrants within the United States • Impact of immigration on the United States • Destinations • California = one-fifth of all immigrants and one-fourth of undocumented immigrants • New York = one-sixth of all immigrants • Immigrants are not distributed uniformly through the United States. Chain Migration is the migration of people to a specific location because relatives or members of the same nationality previously migrated there. • Examples ???
U.S. States as Immigrant Destinations California is the destination of about 25% of all U.S. immigrants; another 25% go to New York and New Jersey. Other important destinations include Florida Texas, and Illinois.
What Are The Obstacles To Migration? What are some physical intervening obstacles? • Mountains • Water • Other Examples? Distance to destination – Actual vs. Friction (ex. Germany, Israel) Immigration policies of host countries • U.S. quota laws - global quota of 620,000, with no more than 7% from one country (The Quota Act – 1921; The National Origins Act 1924) • Temporary migration for work - guest workers (Europe, Middle East) • Time-contract workers – Asia • Economic migrants or refugees? – Cuba, Haiti, Vietnam Cultural problems faced while living in host countries • U.S. attitudes to immigrants • Attitudes to guest workers
Guest Workers in Europe Guest workers emigrate mainly from Eastern Europe and North Africa to work in the wealthier countries of Western Europe.
Emigration from China Various ethnic Chinese peoples have distinct patterns of migration to other Asian countries.
Migration of Vietnamese Boat People Many Vietnamese fled by sea as refugees after the war with the U.S. ended in 1975. Later boat people were often considered economic migrants.
Brain Drain Countries give preference to skilled workers, U.S. immigration policy contributes to a brain drain, which is a large – scale emigration by talented people. Nearly one-fourth of all legal immigrants to the United States have attended graduate school, compared to less than one-tenth of native – born Americans.
Why Do People Migrate Within a Country? Migration between regions of a country • U.S. settlement patterns • Colonial settlement • Early settlement in the interior (early 1800s) • California • Gold Rush in the 1840s • Great Plains settlement • Recent growth of the South
Center of Population in the U.S. The center of U.S. population has consistently moved westward, with the population migration west. It has also begun to move southward with migration to the southern sunbelt.
American Settlement • Early Settlement in the Interior – By 1830 the center of population moved west of West Virginia. After 1830 the population center moved west more rapidly, to just west of Cincinnati, Ohio, in 1880. The population center shifted west rapidly because most western pioneers during the mid-nineteenth century passed through the interior of the country on their way to California. • Settlement of the Great Plains – The United States population center continued to migrate westward at a much slower pace after 1880.. In part because large migration to the East Coast… offset some of the migration to the U.S. West. The westward movement of the U.S. population center also slowed after 1880 because people began to fill in the area between the 98th meridian and California.
U.S. Interregional Migration Loup Valley, Nebraska 1886
American Settlement • Between 1950 and 1980 the population center moved west faster. In 1980 the population center jumped west of the Mississippi River. • Recent Growth of the South – During the 1990’s, for the first time more Americans migrated out of the West than to the West. The population center has moved southward since 1980. Americans are immigrating to the South primarily for jobs. People also are migrating to the South for environmental reasons.
Interregional Migration in the U.S. 500 Northeast 250 800 400 Midwest 750 300 West 600 1,600 1,000 1,000 1,600 South 1,500 1995 Average annual migrations between regions in the U.S. in 1995 and in 2007
Interregional Migration in the U.S. 93 Northeast 56 118 56 Midwest 125 77 West 199 299 176 244 228 South 300 2007 Figures shown in thousands
Why Do People Migrate within a Country? Two main types of internal migration are interregional and intraregional. • Interregional migration is between rural and urban areas • Intraregional migration is from older cities to suburbs • Center of Population – population center is the average location of everyone in the country “center of population gravity.”
Migration between Regions and Other Countries Russia – Soviet policy encouraged factory construction near raw materials rather than near existing population concentrations. The collapse of the Soviet Union ended policies that encouraged interregional migration. Brazil – Most Brazilians live in large cities on the Atlantic coast. To increase the attractiveness to the interior, the government moved its capital in 1960 from Rio to Brasilia. Offered incentives for people to move into the interior. Indonesia – Since 1969 the government has paid for the migration of more than 5 million people, primarily from the island of Java, to less populated islands.
Migration between Regions in Other Countries Europe – Throughout Western Europe … the regions with net migration are also the ones with the highest per capita income. India – Indians require a permit to migrate to the State of Assam. The restrictions, which date from the British rule, are designed to protect the ethnic identity of Assamese. There is restricted migration in India.
The Polish plumber“emblematic reaction to anti-immigrant sentiment” In 2005, French nationalists complained in the press that Polish plumbers were taking French jobs. (In fact, there was a significant shortage of plumbers in France) The “Polish Plumber” quickly became shorthand across Europe for issues related to immigration and jobs. Poland responded by featuring on its tourism posters a “hunky” male model posing as a plumber and saying seductively, “I’m staying in Poland; won’t you come over?”
Migration Trends • Migration from Rural to Urban Areas Urbanization began with the industrial development. Migration from rural to urban areas has grown in recent years in the less developed countries of Africa, Asia, and Latin America. (primary reason = economic migration) • Migration from Urban to Suburban Areas In more developed countries , most intraregional migration is from central cities out to suburbs (primary reason = suburban lifestyle) • Migration from Metropolitan to Nonmetropolitan Areas More developed countries of North America and Western Europe are witnessed a new trend. More people immigrated into rural areas than emigrated out of them. Net migration from urban to rural areas is called counterurbanization.
Intraregional Migration in the U.S. 2007 Average annual migration among urban, suburban, and rural areas in the U.S. During the 1990s, the largest flow was from central cities to suburbs.
Net in-migration and Net out-migration Canada Atlantic Ocean Pacific Ocean Russia 2.0 and above 1.0-1.99 0.50-.099 0.01-0.49 Mexico Canada Gulf of Mexico 0.00 Rocky Mtns region net in-migration (rural counties) Great Plains region net out-migration (rural counties) 0.01-0.49 0.50-0.99 1.0-1.99 2.0 and above U.S net migration by county, 2007.