Account Management
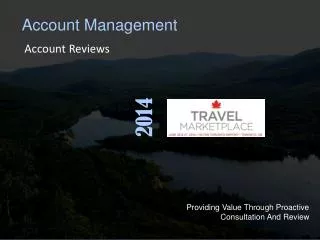
Account Management. Account Reviews. 2014. Providing Value Through Proactive Consultation And Review. Today’s Presenter. Don Kennedy Senior Vice President Forte Business Travel Solutions. 2014.

Account Management
E N D
Presentation Transcript
Account Management Account Reviews 2014 Providing Value Through Proactive Consultation And Review
Today’s Presenter Don Kennedy Senior Vice President Forte Business Travel Solutions 2014
The Purpose of Account Management is to Ensure Agency Profitability, Client Retention and Satisfaction. Comprehensive Program Overviews Are a Key Component in Showing Value to the Client. 2014
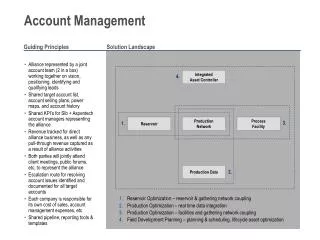
Account Review Goals • To Show Tangible Value Using ROI Metrics • Review Vendor Programs and Performance – Make Recommendations • Demonstrate Agency Compliance With Company’s Annual Business • Travel Plan • Review Company / Traveler Compliance • Business Plan Goals - Assessment & Correction 2014
Account Review Goals • Travel Policy Review • Process Improvement / Technology Review • Consulting Prowess – Advocacy • Progress / Travel Program Investment • Recap 2014
Program Goal Metrics Goal Performance Variance 7+ Day Advance Booking Performance 80% 75% 5% Online Booking Tool Adoption 60% 68% 8% Lost Savings 10% 8% 2% Preferred Hotel Compliance 70% 60% 10% Preferred Car Rental Compliance 85% 86% 1% Low Fare Acceptance 90% 92% 2% Air Without Hotel 15% 25% 10% 2014
Account Review Components • Industry Overview / Trends and Analysis • Air • Car Rental • Hotel • Ground • Dining & Entertainment • Technology – Agency, Company, Traveler (Mobile) 2014
Account Review Components • Preferred Vendor Review • Benchmarking (National & Peer) • Meetings Management • Savings Recommendations by Segment • Process Review • Show Me the Money Page (ROI) • Program Conclusions / Changes / Updates to Plan 2014
Industry Overview 2014
Industry Overview Although travel suppliers will continue to increase domestic rates slightly in 2014 overall growth will remain flat. This trend is attributable to uncertainties in the business environment due to a variety of financial factors and lower consumer confidence. Although recent trends show modest growth in some business sectors, companies are being cautious in expanding their operations domestically. International travel should grow between 5% and 7% as organizations continue to increase their presence in the global marketplace. 2014
Worldwide T&E Breakdown As noted in the chart above companies will need to expand their focus on more areas of their overall travel spend to further drive costs out of their travel programs. A well crafted and enforced travel policy, use of a single TMC, vendor negotiations, reporting and appropriate technologies are key components to reducing overall travel expense. 2014
Industry Average Ticket Prices 2013 will see modest average ticket price increases domestically with slightly larger increases internationally (See chart below). Airlines will continue to cut capacity and “right size” their fleets to increase revenues. 2014
Program Goal Metrics Policy Compliance Goal Performance Variance 7+ Day Advance Booking Performance 80% 75% 5% Online Booking Tool Adoption 60% 68% 8% Lost Savings 10% 8% 2% Preferred Hotel Compliance 70% 60% 10% Preferred Car Rental Compliance 85% 86% 1% Low Fare Acceptance 90% 92% 2% Air Without Hotel 15% 25% 10% 2014
Airfare – Domestic & International Domestic ATP $432 56.8% of Air Spend *International ATP $1,027 43.2% of Air Spend *Includes Trans-border 2014
Air Exception Reports Lost Savings 132,668 53.32 ATP Loss 81 Travelers Had More Than $500 in Lost Savings 2014
Advance Purchase Analysis 0-2 Days 368 3-6 Days 736 7-13 Days 722 14-20 Days 310 20+ Days 352 44.4% within 6 days 2014
Top 10 City Pairs 2014
Top Airline Partners Spend Matches Revenue and Percentage 2014
Airline Program Overview • $97,658 Air Canada Discount Savings • $76,331 West Jet Discount Savings • Delta Small Account Program Savings - *Five US/Trans-Border • Certificate ($2500) • United Small Account Program Savings - *Ten US/Trans-Border • Certificate ($5000) • Porter Small Account Program Savings - *Two US/Trans-Border • Certificate ($1,500) • 25 First Class Upgrades on Air Canada 2014
Account Review Goals Airline City Pairs Goal Performance Variance YYZ – SLP 90% 95% 5% LGA – LHR 70% 82% 12% YVR – LAX 80% 70% 10% Preferred Hotel Compliance Hyatt YYZ 80% 90% 10% Hilton YUL 80% 70% 10% Car Rental Compliance National / Enterprise 85% 77% 8% 2014
Air Recommendations & Observations • Recommend Driving from YYZ to YMQ - Savings: $92, 216 (less car cost) • Pursue American Discount Program To SLP (Currently in Negotiations) • Seek 15% In Additional Business Class Discounts - Trans-Atlantic (DL) • Educate Travelers Concerning Advance Purchase And Lost Savings • Opportunities • Pre-Negotiate International Expansion City Travel In Europe and Asia • Use Policy To Drive Share To ABC Travel To Capture Additional Savings • Tighten POS Guidelines to Drive Down Costs 2014
Document What You Recommend 2014
Hotel Average Daily Rate Comparison This company had 12 account specific negotiated hotel rates. 2014
Hotel Savings & Top Five Markets $20,202 in negotiated savings 2014
Hotel Recommendations & Observations • Move Toronto Hotel Bookings To Hampton Inn Oakville • Potential Savings: $11,892 Based On ADR Of $58.54 Versus $94.36 • Reiterate SLP Westin Policy (No Suites) - Potential Savings $27,207 • Consolidate Detroit Area Spend To One Primary And One Secondary Hotel • Negotiate Montreal Hampton Inn Rate • Pre-Negotiate International Locations In Europe & Asia 2014
Car Rental Analysis Average Daily Rate By Company Avis 49.41 Hertz 49.54 National 42.99 Enterprise 45.22 Budget 39.26 2014
Car Recommendations & Observations • Reduce The Number Of Full Size Rentals • Focus On Preferred Vendor – POS Controls • Put Rental Car Agreement Out To Bid • Potential Savings = $20,000+ ADR Year Over Year Savings - $5,420 (Certificates & Discount) 2014
Other Savings Opportunities • Rail • Dining / Meals • Ground • Charter • Unused Tickets • POS Restrictions • Travel Policy Revision • Personal Car • Mobile Communications • Credit Card 2014
Meetings Management Savings • Require All Groups of 10 or More to Use A Central Meeting • Planning Company • Incorporate Your Meetings Spend Into Vendor Negotiations • Use Technologies to Improve ROI and Reduce Labor • Involve Senior Management in the Process • Adapt Travel / Meetings Policies to Create Required • Synergies 2014
Travel Program ROI 2014
Additional Savings Total: $215,889 Some Agencies Include These Categories As Savings 2014
Account Management Account Reviews 2014 Providing Value Through Proactive Consultation And Review
2013 BOOT CAMP
Travel Technology Landscape General Trends 84 Percentage of Business Travelers Who Use Smart Phones While On the Road. 75 Percentage of Business Travelers Who Access the Internet Via Mobile Phone. Percentage of Business Travelers That Use Tablets Currently 40+ Reardon / Phocuswright
Travel Technology Landscape General Trends 70 Percentage of Business Travelers Using Tablets By Year End 2012 47 Percentage of iPad Users That Have Booked A Hotel Using the Device 37 Percentage of iPad Users That Have Used The Device to Book Airfare Percentage of iPad Users That Have Used The Device to Book Car Rental 24 Graystripe / Reardon / Concur 2013 BOOT CAMP
Travel Technology Landscape General Trends 67 Percentage of SME’s with an Electronic Expense Reporting System Currently In Place 80 Percentage of SME’s with an Electronic Expense Reporting System EOY 2012 88 Percentage of SME’s with an Approved Online Booking Tool By EOY 2012 BTN SME = Small <2M to Medium 2M to <12M Enterprises 2013 BOOT CAMP
Travel Technology Landscape General Trends 2013 BOOT CAMP
Travel Technology Landscape General Trends 2013 BOOT CAMP
Travel Technology Landscape General Trends 2013 BOOT CAMP
Travel Technology Landscape General Trends 2013 BOOT CAMP
Travel Technology Landscape General Trends 2013 BOOT CAMP