Download
1 / 20
200 likes | 401 Vues
Thomas Peter 1 , Jian-Xiong Sheng 1 , Debra Weisenstein 2 , Beiping Luo 1 , Eugene Rozanov 1,3 1 IAC ETHZ, Zurich; 2 Harvard University, Cambridge, MA; 3 PMOD/WRC, Davos.

E N D
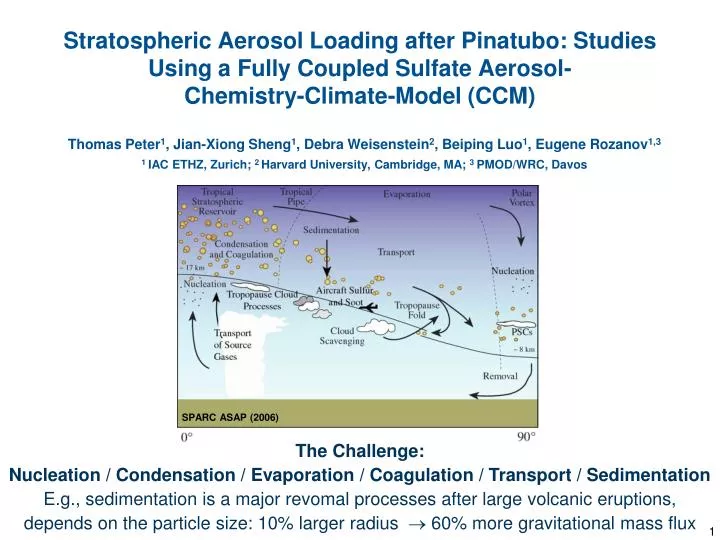
Thomas Peter1, Jian-Xiong Sheng1, Debra Weisenstein2, Beiping Luo1, Eugene Rozanov1,3 1 IAC ETHZ, Zurich; 2 Harvard University, Cambridge, MA; 3 PMOD/WRC, Davos Stratospheric Aerosol Loading after Pinatubo: Studies Using a Fully Coupled Sulfate Aerosol-Chemistry-Climate-Model (CCM) SPARC ASAP (2006) The Challenge: Nucleation / Condensation / Evaporation / Coagulation / Transport / Sedimentation E.g., sedimentation is a major revomal processes after large volcanic eruptions, depends on the particle size: 10% larger radius 60% more gravitational mass flux
SOCOLA: A fully coupled sulfate aerosol CCMThis is a “spectral” or “sectional” or “size-resolving” or “bin” model. Not a “modal” model. Not a “bulk model. CCM SOCOL v3.0: MA-ECHAM5 (GCM) and MEZON (CTM) 39 sigma-pressure vertical levels (up to 0.01 hPa); horizontal T31 or T42 Sea surface temperature prescribed, QBO is nudged based on observations AER aerosol module: all relevant sulfur chemistry and microphysics 40 size bins: 0.39 nm - 3.2 μm (volume doubling) size-dependent composition (Kelvin effect) Model coupling: Each aerosol size bin is transported separately in ECHAM5 incl. sedimentation Interactive radiation scheme: online calculation of optical properties for 22 SOCOL wave bands
Schematic diagram of the global sulfur budget: Burdens in Gg S, fluxes in Gg S/yr Red: SOCOLA Black: AER (as SPARC 2006 ASAP) and obs in brackets Green: GOCART model (Chin et al., 2000) Purple: Chin and Davis (1995) Meteoritic and other non-S species not yet included
SOCOLA comparison with OPC measurements at Laramie, WY, 2000-2010 Solid: OPC cumulative # density (cm-3) Dashed: SOCOLA Symbols: OPC volume density (μm3/cm3) Red line: SOCOLA Excellent agreement in volume density. Good agreement in size distributions, however, deviations for large particles at higher alts: - pvap is too low? Kelvin effect too weak? - Nucleation too slow? Coagulation is too fast? - Too fast meridional transport in the model responsible?
SAGE-4 dataset for CCMI SAGE_4 Stenchikov et al. (1998) • 1024nm extinction • Zonal mean 5°S-5°N • August 1991 • bars: standard dev. of SAGE II (ASAP Report) • The ASAP Report pointed to the importance of the new gap-filling procedure. • However, we failed to high-light the massive short-comings of the outdated datasets. • Furthermore, there is a general lack of accounta-bility and tracability in the old literature (e.g. missing version numbers of SAGE data used)
Comparison of extinction Friday, September 19, 2014 6
Observations of stratospheric aerosol burden – what do we really know? HIRS: Baran and Foot (JGR, 1994): Did "cloud-clearing" work correctly? Also, figure could be read as H2SO4 instead aerosol (Anthony Baran, pers. comm.) Laramie: OPC from ASAP report: Used McCormick et al. (Nature, 1995) for scaling (who concluded 10 TG S injection and ~30 Tg aerosol peak loading) Laramie scaled: OPC from ASAP report: Scaling to only ~21 Tg aerosol peak loading) Laramie scaled: Agrees well with HIRS during early phase and with SAGE-4 from about 9 months after the eruption onward
Observations in comparison with Jason English’s modeling work
Coagulation efficiency ε Coagulation reduces the number density of small particles very efficiently and produces large particles rate of change of number density n due to coagulation ~ - Kn2 Coagulation kernalK is given by Fuch (1964) assuming a UNIT coagulation efficiency English et al., (2013) explicitly introduce Van der Waals forces into K which lead to an increased coagulation efficiency in transition and free molecular regimes. English et al., 2013 Friday, September 19, 2014 9
Low coagulation efficiency may prevail in free molecular regime!Narsimhan and Ruckenstein (1985), D’Alessio et al. (2005), Lindstedt and Waldheim (2013) • van-der-Waals force attractive • but molecular polarization needs time, otherwise force is repulsive
Experiments – Coagulation Efficiency a Pinatubo Simulation: 20 Mt SO2 injected into 16 – 30 km with maximum at 20 - 22 km ε= 1reference runwith QBO and interactive radiation ε= 2double coagulation efficiency in transition and free molecular regimes (simplifying VDW) ε ε= step ε= smooth based on Narsimhan and Ruckenstein (1985) with Hamaker constant 5 x 10-13 erg free molec. Cont. Transition
Time Evolution of Aerosol Opt. Depth in SOCOLA Number of SAGE-II observations available and gap-filled surface area density (SAD)
SOCOLA Particle Sizes Compared with SAGE-II • rmode = 0.205 μm for ε= 2 • rmode = 0.193 μm for ε= Lennard- • Jones • 6% in size • 33% sedimentation flux
Results – Particle Size Comparison with OPC measurement December 1991 R > 0.25 um R > 0.01 um Friday, September 19, 2014 15
Conclusions • SAGE-4λhomogenizes different aerosol data sets (photometers, SAGE I, SAM II, SAGE II, CALIOP) – probably the best we presently have in terms of observations. • Uncertainties in initial S loading remain high (10%), despite careful gap-filling in SAGE-4λ • Aerosol-CCM SOCOLA successfully simulates the time-space development of the main Pinatubo cloud • Tropopause heating is realistic with the observational dataset SAGE-4λ and with SOCOLA • Middle stratospheric aerosols in SOCOLA are too abundant after Pinatubo and under background conditions – for unknown reasons. • Coagulation efficiencies appear to play only a smaller role – if anything ε < 1 might help, not ε > 1
Stratospheric Aerosol Loading after Pinatubo: Studies Using a Fully Coupled Sulfate Aerosol-Chemistry-Climate-Model Thomas Peter, Jianxiong Sheng, Debra Weisenstein, Beiping Luo, Eugene Rozanov The eruption of Mt. Pinatubo in June 1991 emitted 7–11 Mt sulfur into the lower stratosphere. Previous modeling approaches have been unsuccessful to accurately predict the evolution of the stratospheric aerosol burden, and thus the climatic effects. Most modeling attempts yield shorter residence times of the volcanic aerosols in the stratosphere compared to satellite observations. In this study, we coupled a sulfate aerosol module to the global chemistry-climate model (CCM) SOCOL. The AER aerosol module includes comprehensive sulfur chemistry and microphysics, in which the particles are size-resolved by 40 size bins spanning radii from 0.39 nm to 3.2 μm. Radiative forcing is calculated online from the aerosol module using Mie theory. The eruption is modelled assuming various magnitudes of SO2 injections, as well as different initial vertical and meriodional distributions. We put particular emphasis on investigating the aerosol particle coagulation efficiency. By means of a Lennard-Jones potential in the free molecular regime, where very low efficiency values may prevail, the results show that after an eruption the simulated stratospheric aerosol burden agrees well with the high-resolution infrared radiation sounder (HIRS) measurements and the Laramie in situ measurements. Although the coagulation efficiency is largely uncertain, this suggests that the sedimenting large particles form more slowly due to the reduced coagulation process under stratospheric conditions, and therefore stratospheric aerosols may have a longer residence time than derived in previous studies. This study represents the first steps to properly predict large volcanic eruptions and also potential geoengineering measures against dangerous climate change.
English VDW vander Waals x 1.3 SAGE better (HIRS also has troposphere) HIRS better (SAGE is blind)
Stratosphere: free molecular regime for ‘small’particles Knudsen number Kn = mean free path / particle radius Kn < 0.1continuum regime 0.1< Kn < 10transition regime Kn > 10free molecular regime In stratosphere: particles (<50 nm) are generally in free molecular regime!