Download

1 / 27
270 likes | 289 Vues
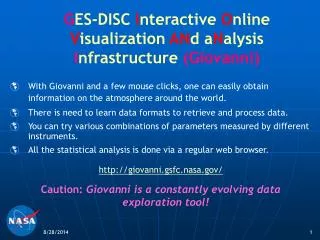
G ES-DISC I nteractive O nline V isualization AN d a N alysis I nfrastructure ( Giovanni). With Giovanni and a few mouse clicks, one can easily obtain information on the atmosphere around the world. There is need to learn data formats to retrieve and process data.

E N D
GES-DISC Interactive OnlineVisualizationANdaNalysis Infrastructure (Giovanni) • With Giovanni and a few mouse clicks, one can easily obtain information on the atmosphere around the world. • There is need to learn data formats to retrieve and process data. • You can try various combinations of parameters measured by different instruments. • All the statistical analysis is done via a regular web browser. • http://giovanni.gsfc.nasa.gov/ • Caution: Giovanni is a constantly evolving data exploration tool!
Giovanni homepage Just Google “nasa” and “giovanni” http://giovanni.gsfc.nasa.gov
What is Giovanni? Data Inputs MLS Aura Area Plot Time Series Model Output OMI Aura AIRS Aqua MODIS Aqua MODIS Terra Giovanni Instances SeaWiFS C A B TRMM B HALOE UARS A C E TOMS EP, N7 C F AMSR-E Aqua D MISR Terra F E D CloudSat CALIOP CALIPSO MERRA Models Correlations Column Densities Profile Cross-Section
Giovanni Capabilities Basic (one-parameter): • Area plot – averaged or accumulated over any data period for any rectangular area (various map projections) • Time plot – time series averaged over any rectangular area • Hovmöller plots –longitude-time or latitude-time cross sections • ASCII output – for all plot types (can be used with GIS apps, spreadsheets, etc.) • Image animation – for area plot • Vertical profiles • Vertical cross-sections, zonal means Beyond basics: • Area plot - geographical intercomparison between two parameters • Time plot - an X-Y time series plot of several parameters • Scatter plot of parameters in selected area and time period • Scatter plot of area averaged parameters - regional (i.e., spatially averaged) relationship between two parameters • Temporal correlation map - relationship between two parameters at each grid • Temporal correlation of area averaged parameters - a single value of the correlation coefficient of a pair of selected parameters • Difference plots • Anomaly plots • Acquiring parameter and spatial subsets in a batch mode through Giovanni
Precipitation Measurements • TRMM: Tropical Rainfall Measuring Mission (Dec 1997 - ) • A joint mission between NASA and the Japan Aerospace Exploration Agency (JAXA) • GPCP: Global Precipitation Climate Project (1979 - ) • Multi-sensor merged precipitation Summer Winter
Air Temperatures Measurements • AIRS/Aqua: Atmosphere InfraRed Sounder (May 2002 -) • Atmospheric temperature profiles • Surface air temperature • Tropopause temperature • MODIS/Aqua: Moderate Resolution Imaging Spectroradiometer (May 2002 -) • temperature profile • MLS/UARS: Microwave Limb Sounder (1991-1999) • upper tropospheric temperature • MLS/Aura: Microwave Limb Sounder (MLS) (Aug 2004 -) • temperature profile • HIRDLS/Aura: High resolution Dynamic Limb Sounder (Jan 2005 -) • temperature profiles
Geopotential Height Measurements Nov 2008, 200 hPa AIRS/Aqua: Atmosphere InfraRed Sounder (May 2002 -) MLS/UARS:Microwave Limb Sounder (1991-1999)
Wind Measurements • QuikSCAT: “Quick” Scatterometer (Jun 1999) • sea surface wind velocity • sea surface wind direction • WIND II/UARS: Wind Imaging Interferometer (1991-1997) • upper atmosphere winds (above 80km) 8/26-27/2005 8/29-30/2005 Winds and precipitation of Hurricane Katrina
Atmospheric Water Vapor Measurements • AIRS/Aqua: Atmosphere InfraRed Sounder (May 2002 -) • Total integrated water vapor • Precipitable water • Relative humidity, Water vapor mixing ratio • MLS/Aura: Microwave Limb Sounder(Jul 2004 -) • mixing ratio of water vapor, Relative humidity • ice water content • MODIS/Terra, MODIS/Aqua: Moderate Resolution Imaging Spectroradiometer (Terra: Dec 1999 -, Aqua: May 2002 -) • water vapor clear sky / cloudy • TRMM: Tropical Rainfall Measuring Mission (Dec 1997 - ) • precipitable water • MLS/UARS: Microwave Limb Sounder (1991-1999) • upper troposphere relative humidity
Cloud Property Measurements • AIRS/Aqua: Atmosphere InfraRed Sounder (May 2002) • Cloud fraction • Cloud top temperature and pressure • Total integrated column cloud liquid water • MODIS/Terra, MODIS/Aqua: Moderate Resolution Imaging Spectroradiometer (Terra: Dec 1999, Aqua: May 2002) • cloud fraction , cloud optical depth • cloud top temperature/pressure • cloud water path • HIRDLS/Aura: High resolution Dynamic Limb Sounder (Jan 2005) • cloud top pressure • OMI/Aura: Ozone Monitoring Instruments (Jul 2004) • Cloud pressure and cloud fraction • MLS/Aura: Microwave Limb Sounder (MLS) (Aug 2004) • ice water content • CloudSAT: (Apr 2005) • Cloud vertical structure and property • CALIPSO: Cloud-Aerosol LIDAR and Infrared Pathfinder Satellite Observations (Apr 2006) • cloud property
Radiation Measurements • AIRS/Aqua: Atmosphere InfraRed Sounder (May 2002) • Outgoing longwave radiation • Infrared surface emissivity • OMI/Aura: Ozone Monitoring Instruments (Jul 2004) • UVB irradiance • SUSIM/UARS: Solar Ultraviolet Spectral Irradiance Monitor (1991-2005) • ultraviolet radiation • SORCE: Solar Radiation and Climate Experiment (Feb 2003) • total solar irradiance • solar spectral irradiance AIRS OLR Nov 2008
Atmospheric Aerosols Measurements • OMI/Aura: Ozone Monitoring Instruments (Jul 2004) • Near-UV aerosol extinction and absorption optical depth • multi-wavelength aerosol optical depth • MODIS/Terra, MODIS/Aqua: Moderate Resolution Imaging Spectroradiometer (Terra: Dec 1999, Aqua: May 2002) • aerosol optical depth at 550 nm • aerosol small mode fraction and optical depth • Angstrom 470/660 nm (land) and 550/865 nm (ocean) • TOMS: Total Ozone Mapping Spectroradiometer (1978-2003) • HALOE/UARS: HALogen Occultation Experiment (1991-2005) • MISR/Terra: Multi-angle Imaging SpectroRadiometer (Dec 1999) • SeaWiFS/OrbView-2: Sea-viewing Wide Field-of-view Sensor ( Sep 1997) • aerosol optical thickness at 865 nm (ocean only)
Ozone Measurements • TOMS: Total Ozone Mapping Spectrometer (1978-2003) • HALOE/UARS: HALogen Occutlation Experiment (1991-2005) • AIRS/Aqua: Atmosphere InfraRed Sounder (May 2002 -) • OMI/Aura: Ozone Monitoring Instrument (Jul 2004 -) • MLS/Aura: Microwave Limb Sounder(Jul 2004 - ) • HIRDLS/Aura: High Resolution Dynamics Limb Sounder (Jul 2004 -) • vertical profile of ozone OMI Ozone Oct 2008
Atmospheric Trace Gases Measurements • AIRS/Aqua: Atmosphere InfraRed Sounder (May 2002) • Total column CO • Effective CO volume mixing ratio for 7 layers • Effective CH4 volume mixing ratio for 3 layers • OMI/Aura: Ozone Monitoring Instruments (Jul 2004) • Total and tropospheric NO2 • Total column SO2 • MLS/Aura: Microwave Limb Sounder(Jul 2004) • mixing ratio of SO2, N2O, CO, Bro, CH3CN, CIO, … • HIRDLS/Aura: High Resolution Dynamics Limb Sounder (Jul 2004) • vertical profile of HNO3, CFC-11, CFC-12 • HALOE/UARS: HALogen Occultation Experiment (1991-2005) • concentration methane, and nitrogen family • MLS/UARS: Microwave Limb Sounder (1991-1999) • chlorine monoxide, methyl cyanide, nitric acid, sulfur dioxide • More information about atmospheric composition and data: • http://disc.gsfc.nasa.gov/acdisc/
Ocean Measurements • SeaWiFS/OrbView-2: Sea-viewing Wide Field-of-view Sensor (Sep 1997 -) • chlorophyll a concentration • diffuse attenuation coefficient at 490 nm • normalized water-leaving radiance at 412, 443, 490, 510, 555, 670nm • MODIS/Aqua: Moderate Resolution Imaging Spectroradiometer (Jul 2002 -) • chlorophyll a concentration • diffuse attenuation coefficient at 490 nm • normalized water-leaving radiance at 412, 443, 488, 531, 551, 667nm • SST at 4, 11 micron SeaWiFSChla Aug-Sep 2008
Land Surface and Cryosphere Data • Fire: MODIS/Terra, MODIS/Aqua • Vegetation Index: MODIS/Terra, MODIS/Aqua • Soil Moisture: AMSR-E • Snow/Ice: NESDIS/IMS
Model Data MERRA: MODERN ERA RETROSPECTIVE-ANALYSIS FOR RESEARCH AND APPLICATIONS (1979 – 2008) NASA reanalysis of atmospheric observations from using GEOS-5, focusing on hydrological cycle, resolution 1/2x2/3x72 GOCART: Goddard Chemistry Aerosol Radiation and Transport (2000-2006) simulates tropospheric aerosols HemTAP: Intercomparisons of 40 Air Quality Models (2001-) (coming soon) GLDAS: 4 Land Surface Models (1979 - )(coming soon)
NASA MERRA Reanalysis Products Two new Giovanni instances supporting the recently released 30 years (1979-2008) Modern Era-Retrospective-analysis for Research and Applications (MERRA), the NASA reanalysis for the satellite era using GEOS-5, focusing on historical analyses of the hydrological cycle on a broad range of weather and climate time scales. Annual mean total surface precipitation of year 1980 over northern America. Zonal averaged vertical cross section map for air temperature in Jul 1999. Cloud top pressure of Jan 1999 Ozone mixing ratio at upper atmosphere 850 hPa (upper panel) in Dec 1999. Wind vertical profiles over an area (80o W – 85oW, 33oN-38oN) for U component (left panel) and V component (right panel) in July 1980. Northern hemisphere snow mass in Dec 1999
Giovanni Provides Comparisons Of Observations and Model Map of the Differences between Model and Observations Overlay of Contours of one parameter over 2D colored map of another parameter
Long-Range Transport of Smoke and Dust Aerosols OMI Absorption Aerosol Optical Depth July 2007 Aerosol Index Time-Longitude Map & Transport of African Dust West to East Dust Smoke The global map of July 2007 OMI Absorption Optical Depth (on the left) shows North African dust traveling westward over the Atlantic Ocean and reaching Mexico and North America. It also shows smoke plumes from the biomass burning from central Africa. The Aerosol Index map on the right shows westward transport of North African dust plumes with time. The dust plume which lifted above ground on June 6 at 20 deg E reached Gulf of Mexico in two weeks. Aerosol index is a very good indicator of absorbing aerosols such as smoke and dust.
OMI can see UV absorbing Aerosols (dust & smoke) over clouds Asian dust plumes usually start in March and mainly build up over Taklamakan and Gobi deserts and move eastwards, travel over the Pacific and reach the west coast of America. On the right, the map of OMI Aerosol Index of April 7, 2005 shows dust plume over East China, Korea and Japan. Dust Plumes Over Cloud On the left is shown Plumes of smoke from a Canadian Boreal Forest Fire for August 16, 2005 These Aerosol index maps have been overlaid on OMI retrieved Cloud Cover to show that OMI can detect aerosols even over clouds. Smokes Over cloud
Stratospheric Ozone Contribution to Tropospheric Ozone OMI Ozone Column Amount AIRS Temperature (Pressure-Time Cross Section) AIRS Relative Humidity (Pressure-Latitude Cross Section) Intrusion AIRS Ozone Column Amount AIRS Temperature (300mb) AIRS Relative Humidity (Pressure-Time Cross Section) Stratosphere-Troposphere Exchange shown using OMI & AIRS Data, March 26-28, 2005
Southern California Wildfires OMI UV Aerosol Index AIRS Carbon Monoxide (CO) OMI Tropospheric NO2 MODIS Cloud Optical Thickness MODIS Small Aerosol Fraction MODIS Aerosol Mass over Land 24