Download
1 / 36
360 likes | 478 Vues
This overview discusses the prevalence and impact of falls among older adults in Minnesota, emphasizing that falls are the leading cause of serious injuries and mortality. Key data from 1998-2005 highlights unintentional falls as the primary cause of injury-related hospitalizations among seniors. The financial burden of falls is substantial, with hospital charges surpassing $1 billion. Effective prevention strategies include enhancing physical activity, medication management, home modifications, and community support. Addressing the root causes is essential for improving safety and health outcomes for the elderly population.

E N D
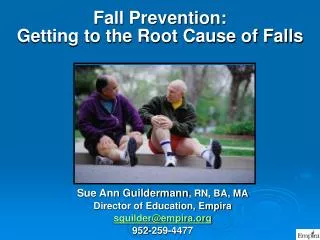
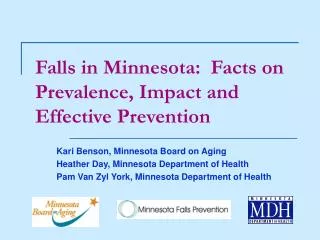
Falls in Minnesota: Facts on Prevalence, Impact and Effective Prevention Kari Benson, Minnesota Board on Aging Heather Day, Minnesota Department of Health Pam Van Zyl York, Minnesota Department of Health
Falls in MinnesotaAge & Disabilities Odyssey Duluth, MN August 20, 2007 Heather Day, RN, MPH Minnesota Department of Health
Falls – leading cause of serious injury Mortality Major Trauma SCI TBI Hospitalized ED-treated
Leading Causes of Injury Deathin Minnesota 1) Motor vehicle crashes 2)Unintentional Falls 3) Self-inflicted Firearm 4) Self-inflicted Poisoning
Leading Causes of Hospitalized Injury Among Persons 65+Minnesota, 1998 - 2005 1)Unintentional Falls (66,149) 2) MV Traffic Crash Occupants (3,677) 3) Unintentional Poisoning (1,884) 4) Overexertion (1,531) 5) Struck By / Against (1,192)
Leading Causes of ED-treated Injury Among Persons 65+Minnesota, 1998 - 2005 1) UnintentionalFalls (98,610) 2) Cut / Pierce (12,059) 3) Struck By / Against (11,252) 4) MV Traffic Crash Occupants (10,483) 5) Overexertion (7,717)
Falls are heterogeneous Ladder Sports Work Slip/trip same level Mechanical vs. organic
Minnesota’s Rates are high…Minnesota’s Rates are increasing…
Unintentional Fall Death Rates,United States and Minnesota,1999-2004 Rates are Age-Adjusted to US 2000 Standard Population.
Nonfatal Hospital-Treated Falls by Month of Admission, 65+Minnesota, 1998-2005
Nonfatal Hospital-Treated Falls by Type and Month of Admission, 65+Minnesota, 1998-2005
Percentage Change in Death Rates for the Leading Causes of Unintentional Injury, by Mechanism of Injury – United States, 1999-2004
Unintentional Fall Death Rates Among Persons Age 65+,United States and Minnesota, 1999-2004 Rates are Age-Adjusted to US 2000 Standard Population.
Unintentional Fall Nonfatal Hospitalization RatesUnited States and Minnesota, 1998-2005 Rates are Age-Adjusted to US 2000 Standard Population.
Rates are highest in elders…Falls in Elders Drive Overall Rates…
Unintentional Fall Nonfatal Hospitalization RatesMinnesota, 1998-2005 Rates are Age-Adjusted to US 2000 Standard Population.
Unintentional Fall Nonfatal Hospitalization Rates, 0-59Minnesota, 1998-2005 Rates are Age-Adjusted to US 2000 Standard Population.
Unintentional Fall Nonfatal Hospitalization Rates, 50+Minnesota, 1998-2005 Rates are Age-Adjusted to US 2000 Standard Population.
Total Acute Care Charges Associated with Nonfatal Falls Among Persons 65+Minnesota, 1998-2005 • Hospital Charges =$1,022,083,080 Range: $83.9 million to $162.1 million per year ED Charges =$106,255,555 Range: $5.8 million to $20.4 million per year
Nonfatal Falls Among Persons 65+:Hip Fracture and TBIMinnesota, 1998-2005 • Hip Fracture:N = 24,969 • 24,381 hospitalizations • 1,488 ED visits • Total charges = $61.1 million • TBI:N = 13,931 • 5,281 hospitalizations • 8,649ED visits • Total charges = $207.9 million
What’s next… • Continued Analysis of Hospital Discharge data • New V code: V15.88 History of Falls • Collection of hospital & TBI elder falls data • Body position • Factors / activity at time of fall • Height • Location • Time of day • Use of anticoagulant or antiplatelet medication • Comorbid health conditions
Falls Prevention Pam Van Zyl York, MPH, PhD, RD, LN Minnesota Department of Health
Falls Prevention and Chronic Disease Management • Keys to chronic disease management include regular physical activity, medication management, education and healthy eating • 80% of those over 65 years have 1 or more chronic condition, 65% have multiple chronic conditions • Those with impaired strength, mobility, balance and endurance are twice as likely to fall as healthier persons • Those with more chronic conditions are more likely to die or sustain more serious injury when they fall
Chronic Disease in Minnesotans 65 yrs + • Age related macular degeneration - Approx. 25% (nationally) • Alzheimers’ Disease - 13% (nationally) • Arthritis - 53% • Diabetes - 13 % • Heart Disease – 6+% • Stroke - 3% • Osteoporosis – 14.4%
Key Elements of a Falls Prevention Intervention • Education • Exercise to increase lower-body strength and balance • Home and environment assessment and modification • Medication review and modification • Vision evaluation and correction • Support for self-management of risk factors and fear • Nutritional considerations?
Safety Promotion This is raising awareness among the elderly and within society in general about the burden of injury from falls and the need to take steps to reduce physical, behavioral, environmental and societal risk factors. Safety promotion includes supporting communities in primary prevention activities and fostering community-based programs. It also includes changing public values and attitudes so that falls and injuries are not seen as the result of unavoidable accidents, but are seen as predictable and largely preventable events. Primary and Secondary Prevention Primary prevention focuses on preventing the first occurrence of a fall, such as risk identification and modification. Including in-depth clinical assessment of elderly individuals at risk of falling by family physicians and other health care professionals, followed by treatment of medical factors or modification of environment or behavior. Treating medical illness, adjusting medication, removing slip and trip hazards from the home, or introducing targeted exercise regimens to improve strength and balance are all primary prevention activities. Secondary prevention aims to minimize the injury or complications once a fall occurs. This may include teaching elderly how to get up after a fall, fostering bone health through diet, exercise or drugs to reduce the chance of fracture and improve strength and balance, or promoting personal alarm systems for seniors to alert others when they have fallen. The aim is to prevent an injury or fall in the future. Emergency Medical Services, Primary Care and Acute Care This includes emergency response and transportation to hospital without delay, assessment and treatment by physicians and further treatment such as orthopedic surgery, if required and the initiation of rehabilitation. This is followed by investigation and correction of factors leading to the fall such as detection and stabilization and treatment of medical conditions that may have contributed to the fall. The result is the reduction of the future morbidity and mortality and the improvement of the outcomes following a fall. Rehabilitation Activities are taken to prevent long-term complications and disability after a fall and to promote rehabilitation and re-integration into the community. The aim is to maximize the level of functioning after a fall and the prevention of future falls. Support in the Community After a fall injury, appropriate home and medical support and follow-up is carried out to enable continued independence and quality of life in the community or long-term care setting. Falls Injury Prevention Model – Points of Intervention Continuum
Falls Injury Prevention Model – Points of Intervention Continuum Primary and Secondary Prevention through evidence-based interventions for falls and chronic disease Emergency medical services, primary care and acute care Safety promotion and increasing awareness among individuals, communities and providers Rehabilitation services Home and medical support in the community
MN Falls Prevention Initiative • MN Board on Aging, Dept of Health and Dept of Human Services • October 2005: 3-year planning grant from U.S. Administration on Aging • Convening a broad range of public and private partners at the state, regional and local levels to implement a statewide coordinated evidence-based falls prevention initiative.
MN Falls Prevention Initiative The Vision Older Minnesotans will have fewer falls and fall-related injuries, maximizing their independence and quality of life.
MN Falls Prevention InitiativeObjectives • Increase awareness of prevalence and risk factors for falls. • Increase assessment of fall risk. • Increase availability of evidence-based interventions statewide. • Increase access to these interventions. • Enhance quality assurance efforts related to falls prevention.
Call to Action • Articulates state “plan” for falls prevention and commitment of partners to work together • Provides framework for action by professionals and community partnerships
MN Falls Prevention Website • Developed through collaborative effort of state partners • Goal: to make it easy to take action to prevent falls • Consumer and Professional Sections • Evidence-based Recommendations
Pam Van Zyl York Minnesota Department of Health, Division of Health Promotion and Chronic Disease pam.york@health.state.mn.us Kari Benson State Project Manager Minnesota Board on Aging kari.benson@state.mn.us Contact Information