Download
1 / 35
350 likes | 468 Vues
Explore QCD phase diagram through energy dependence, system size analysis, and net-baryon distributions. Discover key insights from high and low-energy reactions.

E N D
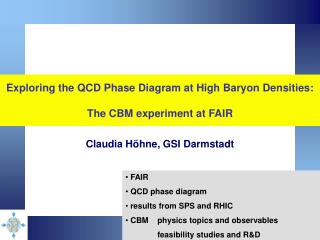
Particle Production at the SPS and the QCD Phase Diagram Christoph Blume University of Frankfurt 26th Winter Workshop on Nuclear Dynamics Ocho Rios, Jamaica January 2010 Christoph Blume University of Frankfurt Winter Workshop on Nuclear Dynamics, 2010, Ochos Rios, Jamaica
Outline How to probe different regions of the QCD phase diagram? Variation of center-of-mass energy Way of scanning different freeze-out parameters T and μB Variation of system size How do T and μB depend on system size Core corona approach Critical point search Systematic study of multiplicity fluctuations Other observables Christoph Blume WWND 2010, Ocho Rios, Jamaica
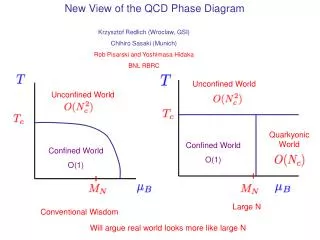
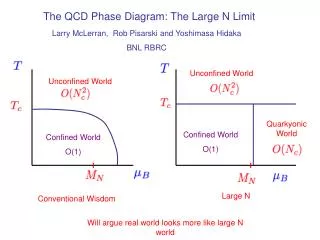
QCD Phase Diagram A. Andronic et al., arXiv: 0911.4806 L. McLarren and R.D. Pisarski, Nucl. Phys. A796, 83 (2007). Christoph Blume WWND 2010, Ocho Rios, Jamaica
QCD Phase DiagramExperimental Access High energies (RHIC/LHC) B small System reaches QGP phase Low energies (AGS) B large System stays in hadronic phase In between (SPS/FAIR) Variation of B by changing sNN Possible to localize critical point? Other control parameters (e.g. system size)? Christoph Blume WWND 2010, Ocho Rios, Jamaica
Energy DependenceNet-Baryon Distributions Significant change of shape at SPS energies Peak dip structure Rapid change of net-baryon density at y = 0 Strong variation of B NA49 preliminary Central Pb+Pb/Au+Au 158A GeV Phys. Rev. Lett. 82 (1999), 2471 E802 Phys. Rev. C 60 (1999), 064901 BRAHMS Phys. Rev. Lett. 93 (2004), 102301 Christoph Blume WWND 2010, Ocho Rios, Jamaica
− − / +/ Energy DependenceExample: /π- and /π-Ratios / • NA49 data • Phys. Rev. C78, • 034918 (2008) • Statistical models • Generally good • description at all • energies • Fixes parameters • T and μB |y| < 0.4 -/ = 1.5 (+ + -) |y| < 0.5 SHM(B): A. Andronic et al. Nucl. Phys. A 772, 167 (2006). UrQMD: M. Bleicher et al., J. Phys. G 25, 1856 (1999) and private communication HSD: E. Bratkovskaya et al., Phys. Rev. C69, 054907 (2004) Christoph Blume WWND 2010, Ocho Rios, Jamaica
QCD Phase DiagramData Points F. Becattini et al., Phys Rev. C69, 024905 (2004). • Results from different • beam energies • Analysis of particle yields • with statistical models • Freeze-out points reach QGP • phase boundary at top SPS • energies • Caveat: Disagreement between • different LQCD results on TC Christoph Blume WWND 2010, Ocho Rios, Jamaica
System Size DependenceFreeze-out Parameter How do freeze-out parameters depend on system size ? Statistical model fits result in different T Central reactions Way to move around in phase diagram? F. Becattini et al., Phys. Rev. C73, 044905 (2005) Christoph Blume WWND 2010, Ocho Rios, Jamaica
p System Size Dependence(Anti-)Proton y-Spectra NA49 preliminary NA49 preliminary p Preliminary data by NA49 Minimum bias Pb+Pb at 158A GeV H. Ströbele et al. arXiv:0908.2777 Christoph Blume WWND 2010, Ocho Rios, Jamaica
NA49 preliminary Cen. p - p per. p+p central Per. NA49 preliminary System Size DependenceNet-Protons No strong system size dependence observed Peripheral spectrum slightly more pronounced y-dependence than central one Beam rapidity not measured! In measured rapdity range similar shape like p+p data ⇒ System size has no big influence on μB p+p Data: M. Aguilar-Benitz et al., Z. Phys. C 50 (1991), 405. Christoph Blume WWND 2010, Ocho Rios, Jamaica
System Size DependenceEnhancement factors of , , and • Enhancement factor • p+p data: NA49 • Early saturation • Nw > 60 • Core Corona Model • f (NW) = fraction of nucleons • that scatter more than once • F. Becattini and J. Manninen, J. Phys. G35, 104013 (2008) • K. Werner, Phys. Rev. Lett. 98, 152301 (2007) • J. Aichelin and K. Werner, arXiv:0810.4465 Pb+Pb Si+Si C+C 158A GeV Christoph Blume WWND 2010, Ocho Rios, Jamaica
System Size DependenceAverage Transverse Mass: mt-m0 • Similar dependence as • for multiplicities observed • Early saturation Nw > 60 • Core Corona model • f(NW) = fraction of nucleons, that • scatter more than once • F. Becattini and J. Manninen, J. Phys. G35, 104013 (2008) • K. Werner, Phys. Rev. Lett. 98, 152301 (2007) • J. Aichelin and K. Werner, arXiv:0810.4465 • NA49 data: • Phys. Rev. C80 (2009), 034906. |y| < 0.4 (0.5) Christoph Blume WWND 2010, Ocho Rios, Jamaica
System Size DependenceCore-Corona: Central ↔ Peripheral Core Corona model f(Npart) = fraction of nucleons, that scatter more than once Centrality dependence Stronger for smaller systems Central reactions Still clear change of fmax with system size Compare fmax(Pb+Pb) ≈ 0.9 and fmax(C+C) ≈ 0.65 ⇒ apparent change of T + μB Not real, just different mixture of core and corona Thanks to K. Reygers for providing the Glauber code • System size is not a • good control parameter • to move around in • QCD phase diagram Christoph Blume WWND 2010, Ocho Rios, Jamaica
System Size DependenceCore-Corona: Asymmetric Systems • Core Corona model • f(Npart) = fraction of nucleons, • that scatter more than once • Centrality dependence • Peculiar shape for small • projectiles (e.g. C, O, Si, S) Limiting case: p + A f(Npart) = 1 / Npart Model applicable in p+A? First attempt in T. Šuša et al., Nucl. Phys. A698 (2002) 491c Christoph Blume WWND 2010, Ocho Rios, Jamaica
Critical PointTheoretical Predictions Lattice QCD difficult for B > 0 Sign problem in Fermion-determinant Progress in recent years (e.g. Fodor and Katz) Results strongly divergent Typically B > 200 MeV Perhaps no critical point at all for B < 500 MeV (de Forcrand and Philipsen) M. Stephanov, CPOD conference 09 Christoph Blume WWND 2010, Ocho Rios, Jamaica
Critical PointObservables Elliptic flow v2 R. A. Lacey et al., arXiv:0708.3512: η/s versus T and μB. E. Shuryak, arXiv:hep-ph/0504048: Decrease (increase) of baryon (meson) flow. Higher experimental precision required. mt-Spectra of baryons and anti-baryons Asakawa et al., Phys. Rev. Lett. 101 (2008) 122302. Higher experimental precision required. Di-pion (sigma) intermittency study T. Anticic et al., arXiv 0912.4198. No unambiguous signal seen yet Fluctuations: multiplicity and/or 〈pt〉 Stephanov, Rajagopal, Shuryak, Phys. Rev. D60 (1999), 114028. Christoph Blume WWND 2010, Ocho Rios, Jamaica
Critical PointMultiplicity Fluctuations Pb+Pb, 158A GeV 1 < y < ybeam • Charged multiplicity n • Extensive quantity • tight centrality selection (1%) • to reduce volume fluctuations • Scaled variance • Energy dependence of • Data narrower than Poisson ( < 1) • Trend reproduced by UrQMD Christoph Blume WWND 2010, Ocho Rios, Jamaica
n-Fluctuations as a function of B Amplitude of Fluctuations: M. Stephanov et al. Phys. Rev. D60, 114028 (1999) Width of crit. region: Y. Hatta and T. Ikeda, Phys. Rev. D67, 014028 (2003) Position of crit. point: Z. Fodor and S. Katz JHEP 0404, 050 (2004) B from stat. model fit: F. Becattini et al., Phys. Rev. C73, 044905 (2006) NA49 data: Phys. Rev. C79, 044904 (2009) Critical PointMultiplicity Fluctuations Christoph Blume WWND 2010, Ocho Rios, Jamaica
Critical PointElliptic Flow v2 Energy dependence of v2 of protons and pions Large systematic effects Especially for proton v2! Clearly needs improvements on the experimental side Christoph Blume WWND 2010, Ocho Rios, Jamaica
Critical PointTheoretical Predictions • Critical region • Larger area in T - B plane • Focusing effect • Proximity of critical point • might influence isentropic • trajectories (nB/s = const.) Y. Hatta and T. Ikeda, Phys. Rev. D67, 014028 (2003) Askawa et al., Phys. Rev. Lett. 101, 122302 (2008) Christoph Blume WWND 2010, Ocho Rios, Jamaica
Critical Pointmt-Spectra of Baryons and Antibaryons • Expectation: B/B ratio • should fall with mt • Askawa et al., • PRL. 101, 122302 (2008) No significant energy dependence of slope a observed K. Grebieszkov et al., Nucl. Phys. A830 (2009), 547c Christoph Blume WWND 2010, Ocho Rios, Jamaica
Summary How to probe different regions of the QCD phase diagram ? Variation of center-of-mass energy Good control parameter to move around in phase diagram Variation of system size Changes only relative contribution of core and pp-like corona (if core-corona ansatz holds) Change in T only apparent, μB = const. Search for critical point First results from multiplicity fluctuations negative Need for better observables Multi-dimensional (scale and pt-dependent) fluctuation studies Christoph Blume WWND 2010, Ocho Rios, Jamaica
System Size Dependencep+A Collisions No clear evidence for decrease with Npart Significant decrease visible only for anti-lambda Data not fully consistent NA57: F. Antinori et al., J. Phys. G32 (2006) 427 NA49: T. Šuša et al., Nucl. Phys. A698 (2002) 491c Christoph Blume WWND 2010, Ocho Rios, Jamaica
Critical PointDi-Pion (Sigma) Intermittency π+π- Pairs above di-pion threshold Factorial moments F2(M) M: Number of bins in transverse momentum space Subtract mixed event background ⇒ ΔF2(M) Search for power law behavior ΔF2(M) ∼ (M2) Φ2 Φ2 : critical exponent Φ2 > 0 for Si+Si Coulomb effects become an issue for larger systems p+p, C+C, Si+Si at 158A GeV T. Anticic et al. arXiv 0912.4198 N.G. Antoniou, F.K. Diakonos, and G. Mavromanolakis Christoph Blume WWND 2010, Ocho Rios, Jamaica
Critical Pointpt-Fluctuations • Measure of pt-fluctuations • Energy dependence of pt • No significant variation with sNN • for central collisions • Trend reproduced by UrQMD Christoph Blume WWND 2010, Ocho Rios, Jamaica
pt-Fluctuations as a function of B Amplitude of fluctuations: M. Stephanov et al. Phys. Rev. D60, 114028 (1999) Width of crit. region: Y. Hatta and T. Ikeda, Phys. Rev. D67, 014028 (2003) Position of crit. point: Z. Fodor and S. Katz JHEP 0404, 050 (2004) B from stat. model fit: F. Becattini et al., Phys. Rev. C73, 044905 (2006) NA49 data: Phys. Rev. C79, 044904 (2009) Critical Pointpt-Fluctuations Christoph Blume WWND 2010, Ocho Rios, Jamaica
Critical PointSystem Size Dependence of n-Fluctuations Stronger n-Fluctuations seen in smaller systems Hypothetic critical point (CP2) at T = 178 MeV and B = 250 MeV F. Becattini et al., Phys. Rev. C73, 044905 (2006) Christoph Blume WWND 2010, Ocho Rios, Jamaica
System Size DependencedN/dy at Mid-rapidity for Λ, Ξ, and Ω • Transport models • OK for • Slightly below • Too low for • UrQMD: H. Petersen et al. • arXiv: 0903.0396 • HSD: W. Cassing and • E. Bratkovskaya, • Phys. Rep. 308, 65 (1999) • and private communication • Core Corona model • OK for and • F. Becattini and J. Manninen, • Phys. Lett. B673, 19 (2009) • J. Aichelin and K. Werner, • arXiv:0810.4465 − Christoph Blume WWND 2010, Ocho Rios, Jamaica
Energy DependenceTotal Multiplicities AGS NA49 RHIC Central A+A collisions Only total multiplicities (4) shown Chemical freeze-out Experimental points in T-B plane Analysis with statistical models Baryons (stopping) B Strange particles T (+ B) Phase boundary reached ? Christoph Blume WWND 2010, Ocho Rios, Jamaica
QCD Phase DiagramPhase Boundary for B = 0 Lattice QCD General consensus: cross over for B = 0 Critical Temperature Tc Depends on order parameter e.g. chiral condensate: or s-quark susceptibility s Significant differences between collaborations (Budapest-Wuppertal, Riken-Bielefeld-Columbia “hotQCD”) Figs. and table: Budapest-Wuppertal-Group, Y. Aoki et al., arXiv:0903.4155. Christoph Blume WWND 2010, Ocho Rios, Jamaica
QCD Phase Diagram K. Rajagopal, MIT CPOD conference 09 Christoph Blume WWND 2010, Ocho Rios, Jamaica
Strangeness in Heavy Ion ReactionsStatistical Models • Assumption: • Multiplicities are determined by • statistical weights (chemical equilibrium) • Grand-canonical partition function: • Parameters: • V, T, B, (s) • Allows in general excellent fits • to measured multiplicities • Limits of applicability ? • Rare particles and low energies A. Andronic, P. Braun-Munzinger, and J. Stachel, arXiv: 0812.1186 F. Becattini et al., Phys. Rev. C69, 024905 (2004) Christoph Blume WWND 2010, Ocho Rios, Jamaica
Energy DependenceK+/π+ and /π--Ratios • Extended statistical model • Higher mass resonances included • (up to 3 GeV) • Improved description of • pions and thus of the K+/+-ratio • Limiting temperature reached • in SPS energy region • Equilibration due to • proximity of phase • boundary? A. Andronic, P. Braun-Munzinger and J. Stachel, arXiv:0812.1186. Christoph Blume WWND 2010, Ocho Rios, Jamaica
Energy DependenceK+/π+-Ratio: Comparison to STAR Data STAR measurements at lower energies √sNN = 9.2 + 19.6 GeV Good agreement with NA49 data STAR: L. Kumar et al., SQM2008 arXiv:0812.4099 Christoph Blume WWND 2010, Ocho Rios, Jamaica