

Abstract
E N D
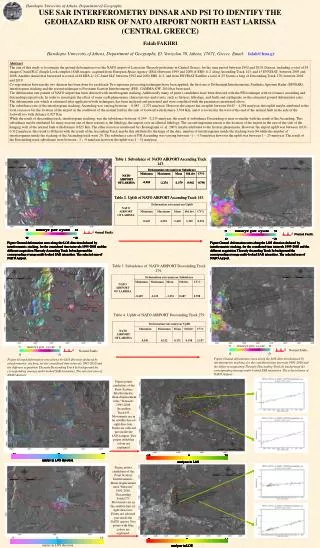
Presentation Transcript
Normal Faults. Figure Ground deformation rates along the LOS direction deduced by interferometric stacking, for the considered time intervals 1995-2008 and the different acquisition Thessaly Ascending Track In background the corresponding average multi-looked SAR intensities. The selected area of NATO Airport. Figure Ground deformation rates along the LOS direction deduced by interferometric stacking, for the considered time intervals 1995-2008 and the different acquisition Thessaly Ascending Track In background the corresponding average multi-looked SAR intensities. The selected area of NATO Airport. Figure Ground deformation rates along the LOS direction deduced by interferometric stacking, for the considered time intervals 1995-2008 and the different acquisition Thessaly Ascending Track In background the corresponding average multi-looked SAR intensities. The selected area of NATO Airport. Figure Ground deformation rates along the LOS direction deduced by interferometric stacking, for the considered time intervals 1995-2008 and the different acquisition Thessaly Ascending Track In background the corresponding average multi-looked SAR intensities. The selected area of NATO Airport. Figure Ground deformation rates along the LOS direction deduced by interferometric stacking, for the considered time intervals 1995-2008 and the different acquisition Thessaly Ascending Track In background the corresponding average multi-looked SAR intensities. The selected area of NATO Airport. Figure Ground deformation rates along the LOS direction deduced by interferometric stacking, for the considered time intervals 1995-2008 and the different acquisition Thessaly Ascending Track In background the corresponding average multi-looked SAR intensities. The selected area of NATO Airport. Figure Ground deformation rates along the LOS direction deduced by interferometric stacking, for the considered time intervals 1995-2008 and the different acquisition Thessaly Ascending Track In background the corresponding average multi-looked SAR intensities. The selected area of NATO Airport. -11 0 30 -11 0 30 -15 0 25 mm/yr in LOS direction mm/yr in LOS direction mm/year in LOS -9 0 11 mm/year in LOS Harokopio University of Athens, Department of Geography USE SAR INTERFEROMETRY DINSAR AND PSI TO IDENTIFY THE GEOHAZARD RISK OF NATO AIRPORT NORTH EAST LARISSA (CENTRAL GREECE) Falah FAKHRI Harokopio University of Athens, Department of Geography, El. Venizelou 70, Athens, 17671, Greece. Email: falah@hua.gr Abstract The aim of this study is to estimate the ground deformation over the NATO airport of Larissa in Thessaly prefecture in Central Greece, for the time period between 1992 and 2010. Dataset, including a total of 24 images C band SLC (Single Look complex) SAR images, acquired from European Space Agency (ESA).Between 1995 and 2008 of ERS-1/-2 along Ascending Track 143, and 15 ENVISAT- between 2003 and 2008. Another dataset has been used is a total of 48 ERS-1/-2 C-band SLC between 1992 and 2000 ERS-1/-2, and from ENVISAT Satellite a total of 25 Scenes a long of Descending Track 279, between 2002 and 2010. Co-registration between the two datasets has been done for each track.Two separates processing techniques have been applied, the first one is Differential Intreferometric Synthetic Aperture Radar (DINSAR), interferogram stacking and the second technique is Persistent Scatters Interferometry (PSI). GAMMA S/W, 2010 has been used. The deformation rate pattern of NATO airport has been detected with interferogram stacking. Additionally many of point’s candidates have been detected with the PSI technique with two frames ascending and descending respectively, In order to investigate the effect of some earth phenomena, characteristics and events, such as fissures, lithology, and faults and earthquake on the estimated ground deformation rates. The deformation rate which is estimated after application both techniques, has been analyzed and presented and were correlated with the parameters mentioned above. The subsidence rate of the interferogram stacking, Ascending was varying between - 0,085 - -2,274 mm/year. However the airport has an uplift between 0,645 – 4,294 mm/year, this uplift maybe attributed to the local reason or for the location of the airport in the southwest of the normal fault in the side of footwall with distance 3,504 Km, and it is located in the west of the end of the normal fault in the side of the footwall too with distance 0,927 Km. While the result of descending track, interferogram stacking, was the subsidence between -0,249- -2,213 mm/year, the result of subsidence Descending is near or similar with the result of the Ascending. This subsidence maybe attributed for many reasons one of these reasons is the lithology, the airport over an alluvial lithology. The second important reason is the location of the airport in the east of the side of the hanging wall of the normal fault with distance 0,625 Km. The other reason as mentioned by (Kontogianni et. al, 2007) maybe attributed to the fissures phenomena. However the airport uplift was between 0,031–0,312 mm/year, this result is different with the result of the Ascending Track maybe this attributed to the huge of the data, number of interferograms inside the stacking were 84 while the number of interferograms inside the stacking of the Ascending track were 29. The subsidence rate of PSI Ascending was varying between -1 - -15 mm/year however the uplift was between 1 – 25 mm/year. The result of the Descending track subsidence were between - 2 - -9 mm/year however the uplift was 1 – 11 mm/year. Table 1. Subsidence of NATO AIRPORT Ascending Track 143. Table 1. Subsidence of NATO AIRPORT Ascending Track 143. Table 2. Uplift of NATO AIRPORT Ascending Track 143. Table 2. Uplift of NATO AIRPORT Ascending Track 143. Normal Faults. Normal Faults. Normal Faults. Normal Faults. Normal Faults. Normal Faults. Figure Ground deformation rates along the LOS direction deduced by interferometric stacking, for the considered time intervals 1995-2008 and the different acquisition Thessaly Ascending Track In background the corresponding average multi-looked SAR intensities. The selected area of NATO Airport. Figure Ground deformation rates along the LOS direction deduced by interferometric stacking, for the considered time intervals 1995-2008 and the different acquisition Thessaly Ascending Track In background the corresponding average multi-looked SAR intensities. The selected area of NATO Airport. Figure Ground deformation rates along the LOS direction deduced by interferometric stacking, for the considered time intervals 1995-2008 and the different acquisition Thessaly Ascending Track In background the corresponding average multi-looked SAR intensities. The selected area of NATO Airport. Figure Ground deformation rates along the LOS direction deduced by interferometric stacking, for the considered time intervals 1995-2008 and the different acquisition Thessaly Ascending Track In background the corresponding average multi-looked SAR intensities. The selected area of NATO Airport. Figure Ground deformation rates along the LOS direction deduced by interferometric stacking, for the considered time intervals 1995-2008 and the different acquisition Thessaly Ascending Track In background the corresponding average multi-looked SAR intensities. The selected area of NATO Airport. Figure Ground deformation rates along the LOS direction deduced by interferometric stacking, for the considered time intervals 1995-2008 and the different acquisition Thessaly Ascending Track In background the corresponding average multi-looked SAR intensities. The selected area of NATO Airport. Figure Ground deformation rates along the LOS direction deduced by interferometric stacking, for the considered time intervals 1995-2008 and the different acquisition Thessaly Ascending Track In background the corresponding average multi-looked SAR intensities. The selected area of NATO Airport. . Table 3. Subsidence of NATO AIRPORT Descending Track 279. Table 4. Uplift of NATO AIRPORT Descending Track 279. Normal Faults. Normal Faults. Figure Ground deformation rates along the LOS direction deduced by interferometric stacking, for the considered time intervals 1992-2010 and the different acquisition Thessaly Descending Track In background the corresponding average multi-looked SAR intensities. The selected area of NATO Airport. Figure Ground deformation rates along the LOS direction deduced by interferometric stacking, for the considered time intervals 1992-2010 and the different acquisition Thessaly Descending Track In background the corresponding average multi-looked SAR intensities. The selected area of NATO Airport. Figure points candidates of the Point Scatters Interferometric. Mean displacement rates “between” 1995-2008. Ascending Track143. Movements are in the satellite line-of-sight direction,. Points are selected just inside the NATO airport. Two points with blue colour are explained. -11 0 30 -11 0 30 -11 0 30 -11 0 30 -11 0 30 -15 0 25 -15 0 25 -15 0 25 -15 0 25 -15 0 25 -15 0 25 -15 0 25 mm/yr in LOS direction mm/yr in LOS direction mm/yr in LOS direction mm/yr in LOS direction mm/yr in LOS direction mm/yr in LOS direction mm/yr in LOS direction mm/year in LOS mm/year in LOS mm/year in LOS mm/year in LOS mm/year in LOS mm/year in LOS mm/year in LOS mm/year in LOS Figure points candidates of the Point Scatters Interferometric. Mean displacement rates “between” 1992-2010. Descending Track279. Movements are in the satellite line-of-sight direction,. Points are selected just inside the NATO airport. Two points with blue colour are explained. -9 0 18 -9 0 11 -9 0 11 -9 0 11 -9 0 11 -9 0 11 -9 0 11 -9 0 11 -9 0 11 -9 0 11 mm/yr in LOS direction mm/year in LOS mm/year in LOS mm/year in LOS mm/year in LOS mm/year in LOS mm/year in LOS mm/year in LOS mm/year in LOS


