Download
1 / 118
1.18k likes | 1.41k Vues
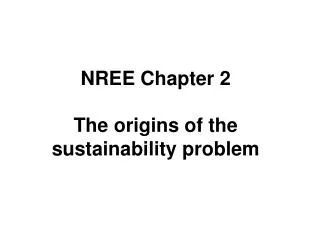
Chapter 2 The origins of the sustainability problem. Learning objectives. In this chapter you will learn how economic activity depends upon and affects the natural environment be introduced to some basic material from the environmental sciences

E N D
Learning objectives In this chapter you will • learn how economic activity depends upon and affects the natural environment • be introduced to some basic material from the environmental sciences • learn about the proximate drivers of the economy’s impact on the environment – population, affluence and technology • review the current state of human economic development • consider the argument that the environment sets limits to economic growth • learn about the emergence of the idea of sustainable development
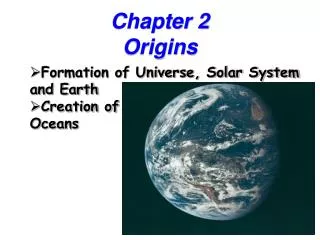
Economy–environment interdependence • Economic activity takes place within, and is part of, the system which is the earth and its atmosphere. • This system we call ‘the natural environment’, or more briefly ‘the environment’. • This system itself has an environment, which is the rest of the universe.
Figure 2.1 • Figure 2.1 is a schematic representation of the two-way relationships between the economy and the environment. • The outer heavy black lined box represents the environment, which is a thermodynamically closed system, in that it exchanges energy but not matter with its environment. • The environment receives inputs of solar radiation. Some of that radiation is absorbed and drives environmental processes. Some is reflected back into space. This is represented by the arrows crossing the heavy black line at the top of the figure. • Matter does not cross the heavy black line. • The balance between energy absorption and reflection determines the way the global climate system functions. The energy in and out arrows are shown passing through three boxes, which represent three of the functions that the environment performs in relation to economic activity. The fourth function, represented by the heavy black lined box itself, is the provision of the life-support services and those services which hold the whole functioning system together. • Note that the three boxes intersect one with another and that the heavy black line passes through them. This is to indicate that the four functions interact with one another.
Economic Activity • Figure 2.1 shows economic activity located within the environment and involving production and consumption, both of which draw upon environmental services, as shown by the solid lines inside the heavy lined box. • Not all of production is consumed. Some of the output from production is added to the human-made, reproducible, capital stock, the services of which are used, together with labour services, in production. • Figure 2.1 shows production using a third type of input, resources extracted from the environment. • Production gives rise to wastes inserted into the environment. So does consumption. Consumption also uses directly a flow of amenity services from the environment to individuals without the intermediation of productive activity.
The services that the environment provides • Natural resources used in production. • Waste assimilation. • Amenity services • Life-support functions for humans
Productive resource services • Natural resources used in production are of several types. • One characteristic: does the resource exists as a stock or a flow. • The difference lies in whether the level of current use affects future availability. • Flow resources: no link between current use and future availability. • Stock resources: level of current use does affect future availability.
Stock resources Stock resources: a second standard distinction concerns the nature of the link between current use and future availability. • Renewable resources are biotic populations – flora and fauna: have potential to grow by natural reproduction. • Non-renewable resources are minerals, including the fossil fuels: no natural reproduction, except on geological timescales.
Distinction between fossil fuels and the other minerals is important. • The use of fossil fuels is pervasive in industrial economies, and is one of their essential distinguishing characteristics. • Fossil fuel combustion is an irreversible process in that there is no way in which the input fuel can be even partially recovered after combustion. • In so far as coal, oil and gas are used to produce heat, rather than as inputs to chemical processes, they cannot be recycled. • Minerals used as inputs to production can be recycled. • This means that whereas in the case of minerals there exists the possibility of delaying, for a given use rate, the date of exhaustion of a given initial stock, in the case of fossil fuels there does not. • Third, fossil fuel combustion is a major source of a number of waste emissions, especially into the atmosphere. e.g. CO2.
Amenity Services • In Figure 2.1 amenity services flow directly from the environment to individuals. • The biosphere provides humans with recreational facilities and other sources of pleasure and stimulation. • The role of the natural environment in regard to amenity services can be appreciated by imagining its absence, as would be the case for the occupants of a space vehicle. • In many cases the flow to individuals of amenity services does not directly involve any consumptive material flow. • However, the flows of amenity services may sometimes impact physically on the natural environment.
Basic life-support functions • The fourth environmental function, shown in Figure 2.1 as the heavy box, is difficult to represent in a simple and concise way. • The biosphere currently provides the basic life-support functions for humans. • While the range of environmental conditions that humans are biologically equipped to cope with is greater than for most other species, there are limits to the tolerable. • We have, for example, quite specific requirements in terms of breathable air. • The range of temperatures that we can exist in is wide in relation to conditions on earth, but narrow in relation to the range on other planets in the solar system. • Humans have minimum requirements for water input.
Interaction • The interdependencies between economic activity and the environment are pervasive and complex. • The complexity is increased by the existence of processes in the environment that mean that the four classes of environmental services each interact one with another. • In Figure 2.1 this is indicated by having the three boxes intersect one with another, and jointly with the heavy black line representing the life-support function.
Substituting for environmental services • In Figure 2.1 there are also some dashed lines. These represent possibilities of substitutions for environmental services. • Consider first recycling. Recycling substitutes for environmental functions in two ways. • First, it reduces the demands made upon the waste sink function. • Second, it reduces the demands made upon the resource base function, in so far as recycled materials are substituted for extractions from the environment.
Substituting for environmental services • Also shown in Figure 2.1 are four dashed lines from the box for capital running to the three boxes and the heavy black line representing environmental functions. • These lines are to represent possibilities for substituting the services of reproducible capital for environmental services. • Some economists think of the environment in terms of assets that provide flows of services, and call the collectivity of environmental assets ‘natural capital’. • In that terminology, the dashed lines refer to possibilities for substituting reproducible capital services for natural capital services.
Other kinds of substitution possibilities • The waste sink function consider again • treatment of discharge of sewage into a river estuary – affects the demand made upon the assimilative capacity of the estuary is reduced for a given level of sewage. • Capital in the form of a sewage treatment plant substitutes for the natural environmental function of waste sink to an extent dependent on the level of treatment that the plant provides. • Energy conservation: substitution of capital for resource base functions. • Amenity services: provision by physical capital may yield close substitutes in some dimensions. • It is often thought that in the context of the life support function substitution possibilities as most limited. • From a purely technical point of view, it is not clear that this is the case. • However, the quantity of human life that could be sustained in the absence of natural life-support functions would appear to be quite small.
Human capital • The possibilities for substituting for the services of natural capital have been discussed in terms of capital equipment. • ‘Human capital’ may also be relevant; this forms the basis for technical change. • However, while the accumulation of human capital is clearly of great importance in regard to environmental problems, in order for technical change to impact on economic activity, it generally requires embodiment in new equipment. • Knowledge that could reduce the demands made upon environmental functions does not actually do so until it is incorporated into equipment that substitutes for environmental functions.
Substitution between sub-components • In Figure 2.1 flows between the economy and the environment are shown as single lines. • Each single line represents what is in fact a whole range of different flows. • With respect to each of the aggregate flows shown in Figure 2.1, substitutions as between components of the flow are possible and affect the demands made upon environmental services. • The implications of any given substitution may extend beyond the environmental function directly affected. • For example, a switch from fossil fuel use to hydroelectric power reduces fossil fuel depletion and waste generation in fossil fuel combustion, and also impacts on the amenity service flow in so far as a natural recreation area is flooded.
Thermodynamics • Thermodynamics is the science of energy. • Energy is the potential to do work or supply heat. It is a characteristic of things, rather than a thing itself. • Work is involved when matter is changed in structure, in physical or chemical nature, or in location. • In thermodynamics it is necessary to be clear about the nature of the system under consideration. • An ‘open’ system is one which exchanges energy and matter with its environment. An individual organism – a human being for example – is an open system. • A ‘closed’ system exchanges energy, but not matter, with its environment. Planet earth and its atmosphere are a closed system. • An ‘isolated’ system exchanges neither energy nor matter with its environment. Apart from the entire universe, an isolated system is an ideal, an abstraction.
Laws of thermodynamics • The first law of thermodynamics says that energy can neither be created nor destroyed – it can only be converted from one form to another. • The first law says that there is always 100% energy conservation whatever people do. Those seeking to promote ‘energy conservation’ actually want to encourage people to do the things that they do now but in ways that require less heat and/or less work, and therefore less energy conversion. • The second law of thermodynamics is also known as ‘the entropy law’. It says that heat flows spontaneously from a hotter to a colder body, and that heat cannot be transformed into work with 100% efficiency. • It follows that all conversions of energy from one form to another are less than 100% efficient. • This appears to contradict the first law, but does not. The point is that not all of the energy of some store, such as a fossil fuel, is available for conversion. • Energy stores vary in the proportion of their energy that is available for conversion. • ‘Entropy’ is a measure of unavailable energy. • All energy conversions increase the entropy of an isolated system. • All energy conversions are irreversible, since the fact that the conversion is less than 100% efficient means that the work required to restore the original state is not available in the new state. • Fossil fuel combustion is irreversible, and of itself implies an increase in the entropy of the system which is the environment in which economic activity takes place. • However, that environment is a closed, not an isolated, system, and is continually receiving energy inputs from its environment, in the form of solar radiation. This is what makes life possible.
Sustainability . • Material transformations involve work, and thus require energy. • Given a fixed rate of receipt of solar energy, there is an upper limit to the amount of work that can be done on the basis of it. • For most of human history, human numbers and material consumption levels were subject to this constraint. • The exploitation of fossil fuels removes this constraint. • The fossil fuels are accumulated past solar energy receipts, initially transformed into living tissue, and stored by geological processes. Given this origin, there is necessarily a finite amount of the fossil fuels in existence. • It follows that in the absence of an abundant substitute energy source with similar qualities to the fossil fuels, such as nuclear fusion, there would eventually be a reversion to the energetic situation of the pre-industrial phase of human history, which involved total reliance on solar radiation and other flow sources of energy. • Of course, the technology deployed in such a situation would be different from that available in the pre-industrial phase. It is now possible, for example, to use solar energy to generate electricity.
Recycling . • The laws of thermodynamics are generally taken to mean that, given enough available energy, all transformations of matter are possible, at least in principle. • On the basis of that understanding it has generally been further understood that, at least in principle, complete material recycling is possible. On this basis, given the energy, there is no necessity that shortage of minerals constrain economic activity. Past extractions could be recovered by recycling. • It is in this sense that the second law of thermodynamics is the ultimate source of scarcity. Given available energy, there need be no scarcity of minerals. • This is what drives the interest in nuclear power, and especially nuclear fusion, which might offer the prospect of a clean and effectively infinite energy resource. • Nicholas Georgescu-Roegen attacked that view as ‘the energetic dogma’, and insisted that ‘matter matters’ as well (Georgescu-Roegen, 1979). • He argued that even given enough energy, the complete recycling of matter is, in principle, impossible. This has been dubbed ‘the fourth law of thermodynamics’ and its validity has been denied. The basis for this denial is that the fourth law would be inconsistent with the second. • This disagreement over what is a very basic scientific issue is interesting for two reasons. • First, if qualified scientists can disagree over so fundamental a point, then it is clear that many issues relevant to sustainability involve uncertainty. • Secondly, both sides to this dispute would agree, that as a practical matter, complete recycling is impossible however much energy is available.
The materials balance principle • ‘The materials balance principle’ : also known as the law of conservation of mass; matter can neither be created nor destroyed. • Economic activity essentially involves transforming matter extracted from the environment. • Economic activity cannot, in a material sense, create anything. It involves transforming material extracted from the environment so that it is more valuable to humans. • All material extracted from the environment must, eventually, be returned to it, albeit in a transformed state. • Figure 2.2: A materials balance model of economy–environment interactions
The materials balance principle • An identity between the mass of materials flow from the environment (flow A) and the mass of residual material discharge flows to the environment (flows B + C + D). • In terms of mass, we have A ≡ B + C + D • In fact several identities are implied by Figure 2.2. Each of the four sectors shown by rectangular boxes receives an equal mass of inputs to the mass of its outputs. So we have the following four identities: • The environment: A ≡ B + C + D • Environmental firms: A ≡ A1 + A2 + C • Non environmental firms: B + R + E ≡ R + A1 + F • Households: A2 + E ≡D + F
Insights • In a materially closed economy in which no net stock accumulation takes place (that is, physical assets do not change in magnitude) the mass of residuals into the environment (B + C + D) must be equal to the mass of fuels, foods and raw materials extracted from the environment and oxygen taken from the atmosphere (flow A). • The treatment of residuals from economic activity does not reduce their mass although it alters their form. Nevertheless, while waste treatment does not ‘get rid of’ residuals, waste management can be useful by transforming residuals to a more benign form (or by changing their location). • The extent of recycling is important. Look again at the identity B + R + E ≡ R + A1 + F. For any fixed magnitude of final output, E, if the amount of recycling of household residuals, F, can be increased, then the quantity of inputs into final production, A1, can be decreased. This implies that less primary extraction of environmental resources, A, need take place. The total amount of material throughput in the system (magnitude A) can be decreased for any given level of production and consumption if the efficiency of materials utilisation is increased through recycling processes.
Production function specification • In most of microeconomics, production (Q) is taken to involve inputs of capital(K) and labour (L). For the ith firm, the production function is written as (2.1) • According to the materials balance principle, this cannot be an adequate general representation of what production involves. If Qi has some material embodiment, then there must be some material input to production – matter cannot be created. • If we let R represent some natural resource extracted from the environment, then the production function could be written as: (2.2)
Production function specification • Production functions with those arguments are widely used in the resource economics literature. • In contrast, the environmental economics literature tends to stress insertions into the environment – wastes arising in production and consumption wastes – and often uses a production function of the form (2.3) • where Miis the flow of waste arising from the ith firm’s activity. • This may appear strange as it treats waste flows as an input into production. However, this is a reasonable way of proceeding given that reductions in wastes will mean reductions in output for given levels of the other inputs, as other inputs have to be diverted to the task of reducing wastes.
Production function specification A synthesis of resource and environmental economics production functions is desirable, which recognises that material inputs (in the form of environmental resources) enter the production function and material outputs (in the form of waste as well as output) emanate from production. This yields a production function such as (2.5) • This has the attractive property of recognising that, in general, production must have a material base, and that waste emissions necessarily arise from that base. • It is consistent with one of the fundamental laws of nature. • It also includes possible feedback effects of wastes on production, arising through the ambient levels of pollutants. • It is uncommon for such a fully specified production function to be used in either theoretical or empirical work in economics. • In particular cases, this could be justified by argument that for the purpose at hand nothing essential is lost by an incomplete specification, and the analysis is simplified and clarified. • However, it is important to keep in mind that it is equation 2.5 itself that is the correct specification of a production process that has a material output.
Ecology • Ecology is the study of the distribution and abundance of plants and animals. • A fundamental concept: the ecosystem, an interacting set of plant and animal populations, together with their abiotic (non-living) environment. • An ecosystem can be defined at various scales from the small and local – a pond or field – through to the large and global – the biosphere as a whole.
Stability and resilience Holling (1973, 1986) • Stability: a property attaching to the populations comprised by an ecosystem • Stability is the propensity of a population to return to some kind of equilibrium following a disturbance. • Resilience: a property of the ecosystem • Resilience is the propensity of an ecosystem to retain its functional and organisational structure following a disturbance. • The fact that an ecosystem is resilient does not necessarily imply that all of its component populations are stable. • It is possible for a disturbance to result in a population disappearing from an ecosystem, while the ecosystem as a whole continues to function in broadly the same way, so exhibiting resilience.
Stability and resilience Common and Perrings (1992) put these matters in a slightly different way. • Stability is a property that relates to the levels of the variables in the system. Cod populations in North Atlantic waters would be stable, for example, if their numbers returned to prior levels after a brief period of heavy fishing was brought to an end. • Resilience relates to the sizes of the parameters of the relationships determining ecosystem structure and function in terms, say, of energy flows through the system. An ecosystem is resilient if those parameters tend to remain unchanged following shocks to the system, which will mean that it maintains its organisation in the face of shocks to it, without undergoing catastrophic, discontinuous, change. • Some economic activities appear to reduce resilience, so that the level of disturbance to which the ecosystem can be subjected without parametric change taking place is reduced. Expressed another way, the threshold levels of some system variable, beyond which major changes in a wider system take place, can be reduced as a consequence of economic behaviour. Safety margins become tightened, and the integrity and stability of the ecosystem is put into greater jeopardy. • When such changes takes place, dose–response relationships may exhibit very significant nonlinearities and discontinuities. Another way of putting this is to say that dose–response relationships may involve thresholds. Pollution of a water system, for example, may have relatively small and proportional effects at low pollution levels, but at higher pollutant levels, responses may increase sharply and possibly jump discontinuously to much greater magnitudes. Such a dose–response relationship is illustrated in Figure 2.3.
Figure 2.3 Non-linearities and discontinuities in dose-response relationships Magnitude of response to a variable of interest 0 Dose applied per period
Ecological footprints • Humanity's ecological footprint‘: the ecological impact of the human species. • An ideal definition (Wackernagel and Rees, 1997) of a particular human economy's ecological footprint is: • “the aggregate area of land and water in various ecological categories that is claimed by participants in the economy to produce all the resources they consume, and to absorb all the wastes they generate on a continuing basis, using prevailing technology.” • An ‘ideal’ definition because to date estimates of the size of ecological footprints have been based on just subsets of consumed resources and generated wastes, and are in that sense conservative estimates. • The footprint size will vary with technology as well as with levels and patterns of production and consumption.
Wackernagel et al. (2002) • Report estimates of the size of the footprint for each of the years from 1961 to 1999, for the whole global economy. • Consider the demands for land and water on account of • growing crops • grazing domesticated animals • harvesting timber • fishing • space for locating human artefacts such as houses, factories, roads, etc. • sequestering the CO2 released in fossil-fuel combustion
Wackernagel et al. (2002) • In relation to the available amounts in the biosphere, they find that for all of humanity the ratio of the former demand to the latter supply increased from approximately 0.7 in 1961 to approximately 1.2 in 1999 • They conclude that as presently constituted the global economy is not sustainable in that it would ‘require 1.2 earths, or one earth for 1.2 years, to regenerate what humanity used in 1999’.
Other footprint statistics • For 2003 the global human ecological footprint was 1.25 ( from http://www.footprintnetwork.org/ May 2008). • On a per capita basis the global average demand for biologically productive space in 2003 was 2.3 hectares • Other studies have estimated per capita footprints of 9.7 hectares for the USA, 5.4 for the UK and 4.7 for Germany. • The implication is that if the developing world were to attain the consumption levels of the developed world, using current technology, the total footprint for the world would be the size of several earths.
Biodiversity • Biodiversity: the number, variety and variability of all living organisms in terrestrial, marine and other aquatic ecosystems and the ecological complexes of which they are parts. • Biodiversity is intended to capture two dimensions: • the number of biological organisms • their variability.
Levels of Biodiversity There are three levels at which biodiversity can be considered: • Population: genetic diversity within the populations that constitute a species is important as it affects evolutionary and adaptive potential of the species, and so we might measure biodiversity in terms of the number of populations. • Species: we might wish to measure biodiversity in terms of the numbers of distinct species in particular locations, the extent to which a species is endemic (unique to a specific location), or in terms of the diversity (rather than the number) of species. • Ecosystems: in many ways, the diversity of ecosystems is the most important measure of biodiversity; unfortunately, there is no universally agreed criterion for either defining or measuring biodiversity at this level.
Measures of biodiversity • A species can be taken to be a set of individual organisms which have the capacity to reproduce • A population is a set that actually do reproduce. A population is, that is, a reproductively isolated subset of a species. • Biodiversity is usually considered in terms of species, and the number of distinct species is often used as the indicator of biodiversity. • There are problems with this measure. • Example: Suppose a harvesting programme targets individuals within that population with a particular characteristic (such as large size). • The target individuals are likely to possess genetic material favouring that characteristic, and so the harvesting programme reduces the diversity of the gene pool in the remaining population. • Managed harvesting programmes may result in loss of biodiversity even though the number of extant species shows no change.
Importance of biodiversity • Biodiversity is important in the provision of environmental services to economic activity in a number of ways. • In regard to life-support services, diverse ecological systems facilitate environmental functions, such as carbon cycling, soil fertility maintenance, climate and surface temperature regulation, and watershed flows. • The diversity of flora and fauna in ecosystems contributes to the amenity services that we derive from the environment. • In relation to inputs to production, those flora and fauna are the source of many useful products, particularly pharmaceuticals, foods and fibres; the genes that they contain also constitute the materials on which future developments in biotechnology will depend. • In terms of agriculture, biodiversity is the basis for crop and livestock variability and the development of new varieties.
Importance of biodiversity • Ecologists see the greatest long-term importance of biodiversity in terms of ecosystem resilience and evolutionary potential. • Diverse gene pools represent a form of insurance against ecological collapse: the greater is the extent of diversity, the greater is the capacity for adaptation to stresses and the maintenance of the ecosystem’s organisational and functional structure.
The current extent of biodiversity. • We have very poor information about this. • The number of species that currently exist is not known even to within an order of magnitude. • Estimates that can be found in the literature range from 3–10 million to 50–100 million. • A current best guess of the actual number of species is 12.5 million. • Even the currently known number of species is subject to some dispute, with a representative figure being 1.7 million species described to date. • About 13000 new species are described each year.
Biodiversity loss and human impact • For ecologists, the appropriation of the products of photosynthesis is the most fundamental human impact on the natural environment, and is the major driver of the current high rate of biodiversity loss. • Lord Robert May, President of the Royal Society: • There is little doubt that we are standing on the breaking tip of the sixth great wave of extinction in the history of life on earth. It is different from the others in that it is caused not by external events, but by us – by the fact that we consume somewhere between a quarter and a half of all the plants grown last year. • Given that the number of species existing is not known, statements about rates of extinction are necessarily imprecise, and there are disagreements about estimates. • Table 2.3 shows data for known extinctions since 1600.
Biodiversity loss and human impact • The actual number of extinctions would certainly be equal to or exceed this. • The recorded number of extinctions of mammal species since 1900 is 20. • It is estimated from the fossil record that the normal, long-run average, rate of extinction for mammals is one every two centuries. In that case, for mammals the known current rate of extinction is 40 times the background rate. • Lord Robert May again: • If mammals and birds are typical, then the documented extinction rate over the past century has been running 100 to more like 1000 times above the average background rate in the fossil record. And if we look into the coming century it’s going to increase. An extinction rate 1000 times above the background rate puts us in the ballpark of the acceleration of extinction rates that characterised the five big mass extinctions in the fossil records, such as the thing that killed the dinosaurs.
Other biodiversity estimates • According to Wilson (1992) there could be a loss of half of all extant birds and mammals within 200–500 years. • For all biological species, various predictions suggest an overall loss of between 1% and 10% of all species over the next 25 years, and between 2% and 25% of tropical forest species (UNEP, 1995). • In the longer term it is thought that 50% of all species will be lost over the next 70 to 700 years (Smith et al., 1995; May, 1988). • Lomborg (2001) takes issue with most of the estimates of current rates of species loss made by biologists. His preferred estimate for the loss of animal species is 0.7% per 50 years, which is smaller than many of those produced by biologists. • It is, however, in Lomborg’s own words: ‘a rate about 1500 times higher than the natural background extinction’. • There really is no disagreement about the proposition that we are experiencing a wave of mass extinctions, and that it is due to the human impact on the environment.
The Millennium Ecosystem Assessment (MEA) • MEA conducted over 2001 to 2005, coordinated by the UNEP. • Intended to assess the implications for human well-being of ecosystem change, and to establish the scientific basis for actions to enhance the conservation and sustainable use of ecosystems and their contribution to human well-being. • Synthesised existing information, rather than seeking to generate new data. • Available as books and for downloading from the MEA website: http://www.millenniumassessment.org/en/index.aspx.
Four main findings of the MEA: • Over the past 50 years, humans have changed ecosystems more rapidly and more extensively than in any comparable period of human history, largely to meet rapidly growing demands for food, fresh water, timber, fiber, and fuel. This has resulted in a substantial and largely irreversible loss in the diversity of life on earth. • The changes that have been made to ecosystems have contributed to substantial net gains in human well-being and economic development, but these gains have been achieved at growing cost in the form of the degradation of many ecosystem services, increased risk of nonlinear changes, and the exacerbation of poverty for some groups of people. These problems, unless addressed, will substantially diminish the benefits that future generations obtain from ecosystems. • The degradation of ecosystem services could grow significantly worse during the first half of this century and is a barrier to achieving the Millennium Development Goals. • The challenge of reversing the degradation of ecosystems while meeting increasing demands for their services can be partially met under some scenarios that the MA has considered, but these involve significant changes in policies, institutions and practices that are not currently under way. Many options exist to conserve or enhance specific ecosystem services in ways that reduce negative trade-offs or that provide positive synergies with other ecosystem services.