Measuring DNSSEC Use
Measuring DNSSEC Use. Geoff Huston APNIC Labs. Our Questions…. What proportion of the Internet’s users will perform DNSSEC validation if they are presented with a signed domain? Where are these DNSSEC-validating users? What is the performance overhead of serving signed names?

Measuring DNSSEC Use
E N D
Presentation Transcript
Measuring DNSSEC Use Geoff Huston APNIC Labs
Our Questions… • What proportion of the Internet’s users will perform DNSSEC validation if they are presented with a signed domain? • Where are these DNSSEC-validating users? • What is the performance overhead of serving signed names? • What happens when the DNSSEC signature is not valid?
The Experiment Three URLs: the good (DNSSEC signed) the bad (invalid DNSSEC signature) the control (no DNSSEC at all) And an online ad system to deliver the test to a large pseudo-random set of clients
Experimental Nits • DNS caching is (for our experiment) evil ! • But massive Signed Zones are a PITA! • And we wanted a very simple approach That Just Worked • So we opted to use a more modest set of 1M signed subdomains • And cycled though these subdomains over a >24 hour period • As long as the resolvers honor the cache TTL of the DNSSEC RRs then resolver caching is avoided and all queries will head to our authoritative server
Understanding DNS Resolvers is “tricky” What we would like to think happens in DNS resolution! x.y.z? x.y.z? Authoritative Nameserver DNS Resolver Client x.y.z? 10.0.0.1 x.y.z? 10.0.0.1
Understanding DNS Resolvers is “tricky” A small sample of what appears to happen in DNS resolution
Understanding DNS Resolvers is “tricky” The best model we can use for DNS resolution
This means… That it is hard to talk about “all resolvers” • We don’t know the ratio of the number of resolvers we cannot see compared to the resolvers we can see from the perspective of an authoritative name server • We can only talk about “visible resolvers”
This means… And there is an added issue with DNSSEC: • It can be hard to tell the difference between a visible resolver performing DNSSEC validation and an occluded validating resolver performing validation via a visible non-validating forwarder (Yes, I know it’s a subtle distinction, but it makes looking at RESOLVERS difficult!)
This means… It’s easier to talk about end clients rather than resolvers, and whether these end clients use / don’t use a DNS resolution service that performs DNSSEC validation
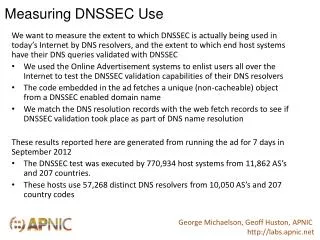
On to Some Results May 2013 • Presented: 2,637,091 experiments to clients • Reported: 2,498,497 experiments that ran to “completion” Web results for clients: • Did Not Fetch invalidly signed object: 8.4% • Fetched all URLs: 91.6%
That means… That 8.4% of clients use DNSSEC validating resolvers, because these clients did not fetch the object that had the invalid DNSSEC signature Right? Well, sort of, but we can learn more if we look at the logs of the DNS queries…
Refining these Results May 2013 • Presented: 2,637,091 experiments • Reported: 2,498,497 experiments that ran to “completion” Web + DNS query log results for clients: • Performed DNSSEC signature validation and did not fetch the invalidly signed object: 8.3% • Fetched DNSSEC RRs, but then retrieved the invalidly signed object anyway: 4.3% • Did not have a DNSSEC clueat all - only fetched A RRs: 87.4%
That means… That 8.3% of clients appear to be performing DNSSEC validation and not resolving DNS names when the DNSSEC signature cannot be validated A further 4.3% of clients are using a mix of validating and non-validating resolvers, and in the case of a validation failure turn to a non-validating resolver!
Another observation from the data Clients who used Google’s Public DNS servers: 7.2% • Exclusively Used Google’s P-DNS: 5.3% • Used a mix of Google’s P-DNS and other resolvers: 1.9%
Where is DNSSEC? – The Top 20 Rank CC Count % D % x % A Country 1 SE 5,349 77.92 3.3818.70 Sweden 2 SI 4,758 58.85 4.90 36.25 Slovenia 3 LU 652 43.87 6.90 49.23 Luxembourg 4 VN 26,665 38.28 4.04 57.69 Vietnam 5 FI 2,456 37.01 16.29 46.70 Finland 6 CZ 30,827 33.20 8.08 58.72 Czech Republic 7 CL 46,151 30.26 8.34 61.41 Chile 8 JM 1,545 28.22 3.11 68.67 Jamaica 9 IE 8,079 27.94 3.11 68.96 Ireland 10 BB 1,312 24.24 1.52 74.24 Barbados 11 ID 54,816 23.87 8.58 67.55 Indonesia 12 UA 26,399 21.65 12.75 65.60 Ukraine 13 ZA 2,969 21.15 9.36 69.48 South Africa 14 TR 49,498 18.06 2.10 79.84 Turkey 15 US 140,234 17.32 3.57 79.11 United States 16 EG 36,061 14.68 10.32 75.01 Egypt 17 GH 973 14.59 8.12 77.29 Ghana 18 AZ 7,409 14.55 30.34 55.11 Azerbaijan 19 BR 179,424 14.43 6.13 79.44 Brazil 20 PS 2,893 14.00 36.85 49.15 Occupied Palestinian T. % of clients who appear to use DNSSEC-validating resolvers % of clients who use non-validating resolvers % of clients who use a mix of DNSSEC-validating resolvers and non-validating resolvers When we geo-locate clients to countries, what proportion of these clients: Perform DNSSEC validation? Retrieve some DNSSEC RRs? Do not retrieve any DNSSEC RRs?
Where is DNSSEC? – The Top 20 Rank CC Count % D % x % A Country 1 SE 5,349 77.92 3.3818.70 Sweden 2 SI 4,758 58.85 4.90 36.25 Slovenia 3 LU 652 43.87 6.90 49.23 Luxembourg 4 VN 26,665 38.28 4.04 57.69 Vietnam 5 FI 2,456 37.01 16.29 46.70 Finland 6 CZ 30,827 33.20 8.08 58.72 Czech Republic 7 CL 46,151 30.26 8.34 61.41 Chile 8 JM 1,545 28.22 3.11 68.67 Jamaica 9 IE 8,079 27.94 3.11 68.96 Ireland 10 BB 1,312 24.24 1.52 74.24 Barbados 11 ID 54,816 23.87 8.58 67.55 Indonesia 12 UA 26,399 21.65 12.75 65.60 Ukraine 13 ZA 2,969 21.15 9.36 69.48 South Africa 14 TR 49,498 18.06 2.10 79.84 Turkey 15 US 140,234 17.32 3.57 79.11 United States 16 EG 36,061 14.68 10.32 75.01 Egypt 17 GH 973 14.59 8.12 77.29 Ghana 18 AZ 7,409 14.55 30.34 55.11 Azerbaijan 19 BR 179,424 14.43 6.13 79.44 Brazil 20 PS 2,893 14.00 36.85 49.15 Occupied Palestinian T. When we geo-locate clients to countries, what proportion of these clients: Perform DNSSEC validation? Retrieve some DNSSEC RRs? Do not retrieve any DNSSEC RRs?
The Mapped view of DNSSEC Use % of users who use DNSSEC-validating resolvers
Is Google’s P-DNS a Factor? Rank CC Count % D %AG %SG %NG Country 1 SE 5,349 77.92 -> 1.78 0.19 98.03 Sweden 2 SI 4,758 58.85 -> 7.89 0.21 91.89 Slovenia 3 LU 652 43.87 -> 1.40 0.00 98.60 Luxembourg 4 VN 26,665 38.28 -> 96.66 2.25 1.09 Vietnam 5 FI 2,456 37.01 -> 2.64 0.33 97.03 Finland 6 CZ 30,827 33.20 -> 11.71 3.99 84.30 Czech Republic 7 CL 46,151 30.26 -> 3.62 0.45 95.92 Chile 8 JM 1,545 28.22 -> 91.74 0.69 7.57 Jamaica 9 IE 8,079 27.94 -> 12.18 0.93 86.89 Ireland 10 BB 1,312 24.24 -> 7.86 0.31 91.82 Barbados 11 ID 54,816 23.87 -> 68.36 12.63 19.01 Indonesia 12 UA 26,399 21.65 -> 19.84 2.15 78.01 Ukraine 13 ZA 2,969 21.15 -> 5.73 0.80 93.47 South Africa 14 TR 49,498 18.06 -> 93.25 3.33 3.41 Turkey 15 US 140,234 17.32 -> 7.28 0.73 91.98 United States of America 16 EG 36,061 14.68 -> 86.28 9.88 3.84 Egypt 17 GH 973 14.59 -> 59.86 14.08 26.06 Ghana 18 AZ 7,409 14.55 -> 71.24 26.72 2.04 Azerbaijan 19 BR 179,424 14.43 -> 50.31 7.08 42.61 Brazil • PS 2,893 14.00 -> 40.49 59.51 0.00 Occupied Palestinian T. % of validating clients who exclusively use Google’s P-DNS % of clients who do not use Google’s P-DNS service % of clients who use a mix of Google’s P-DNS and other resolvers Of those clients who perform DNSSEC validation, what resolvers are they using: All Google P-DNS? Some Google P-DNS? No Google P-DNS?
Is Google’s P-DNS a Factor? Rank CC Count % D %AG %SG %NG Country 1 SE 5,349 77.92 -> 1.78 0.19 98.03 Sweden 2 SI 4,758 58.85 -> 7.89 0.21 91.89 Slovenia 3 LU 652 43.87 -> 1.40 0.00 98.60 Luxembourg 4 VN 26,665 38.28 -> 96.66 2.25 1.09 Vietnam 5 FI 2,456 37.01 -> 2.64 0.33 97.03 Finland 6 CZ 30,827 33.20 -> 11.71 3.99 84.30 Czech Republic 7 CL 46,151 30.26 -> 3.62 0.45 95.92 Chile 8 JM 1,545 28.22 -> 91.74 0.69 7.57 Jamaica 9 IE 8,079 27.94 -> 12.18 0.93 86.89 Ireland 10 BB 1,312 24.24 -> 7.86 0.31 91.82 Barbados 11 ID 54,816 23.87 -> 68.36 12.63 19.01 Indonesia 12 UA 26,399 21.65 -> 19.84 2.15 78.01 Ukraine 13 ZA 2,969 21.15 -> 5.73 0.80 93.47 South Africa 14 TR 49,498 18.06 -> 93.25 3.33 3.41 Turkey 15 US 140,234 17.32 -> 7.28 0.73 91.98 United States of America 16 EG 36,061 14.68 -> 86.28 9.88 3.84 Egypt 17 GH 973 14.59 -> 59.86 14.08 26.06 Ghana 18 AZ 7,409 14.55 -> 71.24 26.72 2.04 Azerbaijan 19 BR 179,424 14.43 -> 50.31 7.08 42.61 Brazil • PS 2,893 14.00 -> 40.49 59.51 0.00 Occupied Palestinian T. Of those clients who perform DNSSEC validation, what resolvers are they using: All Google P-DNS? Some Google P-DNS? No Google P-DNS?
DNSSEC by Networks – the Top 25 Rank AS Count % D %x %A %G AS Name 1 AS39651 710 98.73 0.14 1.13 0.71 Com Hem, SE 2 AS27831 627 97.77 2.23 0.00 0.49 Colombia Movil,CO 3 AS12912 1,486 97.71 1.14 1.14 2.34 ERA Polska Telefonia, PL 4 AS34779 834 96.76 0.84 2.40 1.24 T-2 Slovenia, SI 5 AS29562 582 96.74 0.86 2.41 1.07 Kabel BW GmbH, DE 6 AS5603 1,372 96.72 0.87 2.41 0.53 Telekom Slovenije, SI 7 AS198471 730 96.44 1.10 2.47 99.86 Linkem spa, IT 8 AS719 583 96.05 0.69 3.26 1.07 Elisa Oyj, EU 9 AS5466 2,093 94.70 1.53 3.77 1.21 Eircom, IE 10 AS6849 4,596 92.43 2.15 5.42 3.55 UKRTELECOM, UA 11 AS3301 1,445 91.56 1.45 6.99 1.44 TeliaSonera, SE 12 AS5610 6,889 90.58 2.48 6.94 4.97 TO2 Telefonica Czech Rep., CZ 13 AS7922 24,129 89.57 2.07 8.36 1.09 Comcast Cable, US 14 AS22047 15,274 88.61 9.68 1.71 1.12 VTR BANDA ANCHA, CL 15 AS1257 795 86.29 1.38 12.33 1.60 TELE2, SE 16 AS38511 1,221 79.36 4.18 16.46 10.84 PT Remala Abadi, ID 17 AS2519 523 57.36 3.82 38.81 0.67 VECTANT, JP 18 AS1759 562 51.78 26.51 21.71 2.06 TeliaSonera, FI 19 AS2819 734 48.37 15.53 36.10 20.85 GTSCZ GTS Czech, CZ 20 AS45899 14,306 45.93 3.16 50.91 97.76 VNPT, VN 21 AS27738 950 45.79 40.11 14.11 4.60 Ecuadortelecom, EC 22 AS12301 6,885 42.96 3.59 53.45 5.71 Invitel Tavkozlesi HU 23 AS4230 1,327 37.91 17.48 44.61 59.44 EMBRATEL-EMPRESA, BR 24 AS34170 1,169 36.36 55.18 8.47 72.00 AZTELEKOM Azerbaijan Tele, AZ 25 AS7552 3,708 35.92 5.02 59.06 96.47 Vietel, VN % of clients who appear to use DNSSEC-validating resolvers % of validating clients who exclusively use Google’s P-DNS % of clients who use non-validating resolvers % of clients who use a mix of DNSSEC-validating resolvers and non-validating resolvers
DNSSEC by Networks – the Top 25 Rank AS Count % D %x %A %G AS Name 1 AS39651 710 98.73 0.14 1.13 0.71 Com Hem, SE 2 AS27831 627 97.77 2.23 0.00 0.49 Colombia Movil,CO 3 AS12912 1,486 97.71 1.14 1.14 2.34 ERA Polska Telefonia, PL 4 AS34779 834 96.76 0.84 2.40 1.24 T-2 Slovenia, SI 5 AS29562 582 96.74 0.86 2.41 1.07 Kabel BW GmbH, DE 6 AS5603 1,372 96.72 0.87 2.41 0.53 Telekom Slovenije, SI 7 AS198471 730 96.44 1.10 2.47 99.86 Linkem spa, IT 8 AS719 583 96.05 0.69 3.26 1.07 Elisa Oyj, EU 9 AS5466 2,093 94.70 1.53 3.77 1.21 Eircom, IE 10 AS6849 4,596 92.43 2.15 5.42 3.55 UKRTELECOM, UA 11 AS3301 1,445 91.56 1.45 6.99 1.44 TeliaSonera, SE 12 AS5610 6,889 90.58 2.48 6.94 4.97 TO2 Telefonica Czech Rep., CZ 13 AS7922 24,129 89.57 2.07 8.36 1.09 Comcast Cable, US 14 AS22047 15,274 88.61 9.68 1.71 1.12 VTR BANDA ANCHA, CL 15 AS1257 795 86.29 1.38 12.33 1.60 TELE2, SE 16 AS38511 1,221 79.36 4.18 16.46 10.84 PT Remala Abadi, ID 17 AS2519 523 57.36 3.82 38.81 0.67 VECTANT, JP 18 AS1759 562 51.78 26.51 21.71 2.06 TeliaSonera, FI 19 AS2819 734 48.37 15.53 36.10 20.85 GTSCZ GTS Czech, CZ 20 AS45899 14,306 45.93 3.16 50.91 97.76 VNPT, VN 21 AS27738 950 45.79 40.11 14.11 4.60 Ecuadortelecom, EC 22 AS12301 6,885 42.96 3.59 53.45 5.71 Invitel Tavkozlesi HU 23 AS4230 1,327 37.91 17.48 44.61 59.44 EMBRATEL-EMPRESA, BR 24 AS34170 1,169 36.36 55.18 8.47 72.00 AZTELEKOM Azerbaijan Tele, AZ 25 AS7552 3,708 35.92 5.02 59.06 96.47 Vietel, VN
DNS Performance How can we measure the time taken to resolve each of the three DNSSEC domain name types (signed, unsigned, badly signed)?
Absolute Measurements don’t make much sense… Server Location Average RTT from Client to Server by country of origin (ms)
Relative Measurements … Let’s define the FETCH TIME as the time at the authoritative server from the first DNS query for an object to the HTTP GET command for the same object This time should reflect the DNS resolution time and a single RTT interval for the TCP handshake If the “base” fetch time is the time to load an unsigned DNSSEC object, then how much longer does it take to load an object that is DNSSEC-signed?
Theory… The additional delay here is due to the minimum of 2 additional DNSSEC RR fetches when the resolver is performing validation
Well… • That didn’t work as intended! • The client is running a Flash Engine, and it appears when when you use action code to load up additional URLS then: • The order that the flash engine performs the load is not the same as the order in the action code! • There appears to be an explicit scheduling interval between name resolution phase and the scheduling of the object fetch • Flash Engines appear to use a scheduler that is difficult to understand from this data!
Well… • There is a slight left/right difference in this data, but its difficult to conclude that fetches of DNSSEC-signed objects is consistently slower for clients using DNSSEC-resolving resolvers • So lets focus on the DNS queries • And measure the elapsed time from the first seen to the last seen DNS query for each instance of the experiment
DNS Query Time • This is more like what we expected to see! • For most clients the time taken to perform the DNS queries for the DNSSEC-signed names is longer than the unsigned name • The time taken to perform the DNS queries for the invalidly-signed DNSSEC name is longer than the well-signed name This is unexpected!
What can we say? • DNSSEC takes longer • Which is not a surprise • Additional queries for DS and DNSKEY RRs • At a minimum that’s 2 DNS query/answer intervals • Because it appears that most resolvers serialise and perform resolution then validation • Badly-Signed DNSSEC takes even longer • Resolvers try hard to find a good validation path • And the SERVFAIL response causes clients to try subsequent resolvers in their list
At the other end… Lets look at performance from the perspective of an Authoritative Name server who serves DNSSEC-signed domain names
DNS Query count per Domain Name No DNSSEC (control) DNSSEC signed DNSSEC signed – badly!
DNSSEC Performance At the Authoritative Name Server: Serving DNSSEC-signed zones = More Queries! • The Authoritative server will now see additional queries for the DNSKEY and DS RRs for a zone, in addition to the A (and AAAA) queries 2,637,091 launched experiments 4,222,352 unsigned name queries 7,394,794 signed name queries 12,213,677 badly-signed name queries
What if everybody was doing it? For the control name there are 1.6 queries per experiment The total profile of queries for the control DNS name was: 3.4M A queries 0.4M AAAA queries 0.4M Other (NS, MX, ANY, SOA, CNAME, TXT, A6) queries For the signed name, only 12.6% of clients use DNSSEC-aware resolvers, so the theory (2 additional queries per name) says we will see 4.8M queries But we saw 7.4M queries for the signed DNS Name • If 12.6% of clients’ resolvers using DNSSEC generate an additional 3.1M queries for a signed domain name, what if every DNS resolver was DNSSEC aware? • That would be 25M queries in the context of our experiment A DNSSEC signed zone would see 6 times the query level of an unsigned zone if every resolver performed DNSSEC validation
Good vs Bad for Everyone If 12.6% of clients performing some form of DNSSEC validation generate 12.2M queries for a badly-signed name, compared to the no-DNSSEC control level of 4.2M queries, what would be the query load if every resolver performed DNSSEC validation for the same badly signed domain? • In our case that would be 63M queries A badly-signed DNSSEC signed zone would seen 15 times the query level of an unsigned zone if every resolver performed DNSSEC validation
Response Sizes What about the relative traffic loads at the server? In particular, what are the relative changes in the traffic profile for responses from the Authoritative Server?
DNS Response Sizes These are not constant sizes – the DNS packet sizes of responses relate to the particular name being resolver, the number of keys being used, and the key size So these numbers are illustrative of what is going on, but particular cases will vary from these numbers Control (no DNSSEC) Query: 124 octets Response: 176 octets DNSSEC-Signed Query: (A Record) 124 octets Response: 951 Octets Query: (DNSKEY Record) 80 octets Response: 342 Octets Query: (DS Record) 80 octets Response: 341 Octets Total: Query: 284 octets Total Response: 1634 octets
Interpreting Traffic Data • The validly-signed domain name appears to generate 5x the traffic volume in responses as compared to the unsigned domain name • The badly-signed domain name appears to generate 7.5x the traffic volume in responses • What’s contributing to this? • Setting the DNSSEC OK bit in a query to the signed zone raises the response size from 176 to 951 octets • Performing DNSSEC signature validation adds a minimum of a further 683 octets in DS and DNSKEY responses
What if you just sign your domain? Lets start with the hypothetical question: How much more traffic will you be generating at the Authoritative Server if you sign your domain and NO resolvers perform DNSSEC validation? 76% of clients use resolvers who pass our server queries with EDNS0 + DNSSEC OK flag set 69% of queries for the unsigned zone 75% of queries for the signed zone 83% of queries for the badly-signed zone (aside: why are these proportions different for each of these zones?) If you just sign your zone and no resolvers are performing DNSSEC validation Then from the May data, 69% of queries elicit a larger response then the total outbound traffic load is 4x the traffic load of an unsigned zone But we saw a rise of 5x – why? That’s because 12.6 % of clients are also performing DNSSEC validation
What if everybody was doing it? If 12.6% of clients performing some form of DNSSEC validation for a signed zone generate around 5 times the traffic as compared to an unsigned zone, then what if every resolver performed DNSSEC validation? An authoritative server for a DNSSEC signed zone would’ve seen 13 times the traffic level of an unsigned zone if every resolver performed DNSSEC validation A badly-signed DNSSEC zone would seen 31 times the traffic level of an unsigned zone
DNSSEC means more Server Grunt • Its probably a good idea to plan the serve the worst case: a badly signed zone • In which case you may want to consider provisioning the authoritative name servers with processing capacity to handle 15x the query load, and 30x the generated traffic load that you would need to serve an unsigned zone
It could be better than this… “Real” performance of DNSSEC could be a lot better than what we have observed here • We have deliberately negated any form of resolver caching • Every client receives a “unique” signed URL, and therefore every DNS resolver has to to perform A, DS and DNSKEY fetches for the unique label • The Ad placement technique constantly searches for “fresh eyeballs”, so caching is not as efficient as it could be • Conventional DNS caching would dramatically change this picture • Our 16 day experiment generated 12,748,834 queries • A 7 day TTL would cut this to a (roughly estimated) 2M queries
And it could be a whole lot worse! • For the invalid DNSSEC case we deliberately limited the impact of invalidity on the server • DNSSEC invalidity is not handled consistently by resolvers • Some resolvers will perform an exhaustive check of all possible NS validation paths in the event of DNSSEC validation failure See “Roll Over and Die” (http://www.potaroo.net/ispcol/2010-02/rollover.html) • In this experiment we used a single NS record for the invalidly signed domains • If we had chosen to use multiple nameservers, or used a deeper-signed label path, or both, on the invalid label, then the query load would’ve been (a lot?) higher • Resolver caching of invalidly signed data is also unclear – so a break in the DNSSEC validation material may also change the caching behaviour of resolvers, and increase load at the server
Some things to think about • DNSSEC generates very large responses from very small queries • Which makes it a highly effective DDOS amplifier • Is relying on BCP38 going to work? • Do we need to think about DNS over TCP again? • But how many resolvers/firewalls/other middleware stuff support using TCP for DNS? • What’s the impact on the authoritative server load and caching recursive resolver load when moving from UDP to TCP?
Some things to think about Resolver / Client Distribution • 1% of visible resolvers provide the server with 58% of the seen queries • A few resolvers handle a very significant proportion of the total query volume • But there are an awful lot of small, old, and poorly maintained resolvers running old code out there too!