Download
1 / 29
290 likes | 411 Vues
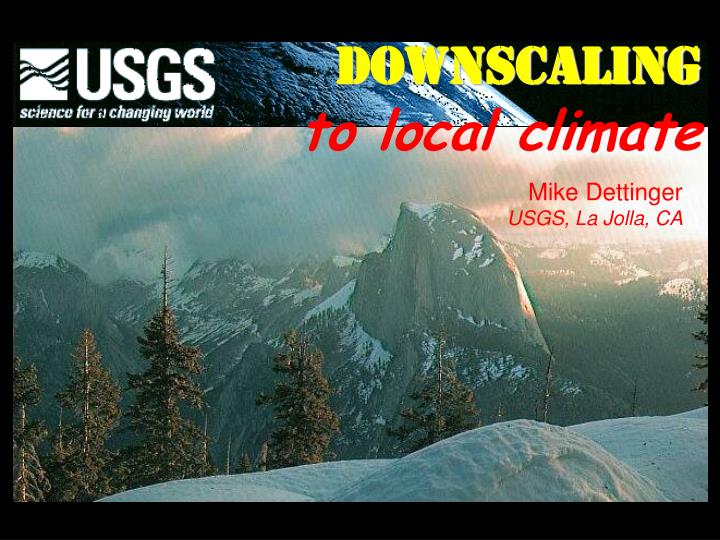
DOWNSCALING to local climate. Mike Dettinger USGS, La Jolla, CA. Downscaled. Original GCM values. The “downscaling” problem. Global Climate Model (actually, general circulation model). One day in the 21st Century. (GFDL A2) . Downscaled. Original GCM values. Downscaling options:

E N D
DOWNSCALING to local climate Mike Dettinger USGS, La Jolla, CA
Downscaled Original GCM values The “downscaling” problem Global Climate Model (actually, general circulation model)
One day in the 21st Century (GFDL A2) Downscaled Original GCM values
Downscaling options: • dT and %P rescaling • Synthetic statistical • Deterministic statistical • Dynamical simulation
dT and %P re-scalings ADD projected mean temperature changes to a historical record Multiply historical record by projected mean precipitation (as fraction of historical) Easy, maintains realistic variability, know exactly what changed No new variability or extremes, not realistic, minimal use of GCM Future (+3C) Historical Historical Future (80%)
Synthetic statistical scenarios e.g., Wilby et al., 2001
Synthetic statistical scenarios Explained Noise Precipitation Explained Noise Temperature e.g., Wilby et al., 2001
Deterministic statistical Local example (Dettinger et al, 2004 Clim Chg) Map GCM variables into historical distribution of variables, maintaining ranks from GCM but absolute values from historical records
Deterministic statistical: A continental scale example Given a daily GCM map to downscale, Hidalgo, H.G., Dettinger, M.D., and Cayan, D.R., in review, Downscaling using constructed analogues daily US precipitation and temperatures: J. Climate, 24 p. The constructed-analogs method
Hidalgo, H.G., Dettinger, M.D., and Cayan, D.R., in review, Downscaling using constructed analogues daily US precipitation and temperatures: J. Climate, 24 p.
Hybrid statistical: • BCSD The Bias-Correction Spatial Disaggregation Method (e.g., Maurer & Hidalgo, 2008 HESS)
BCSD (e.g., Maurer & Hidalgo, 2008 HESS)
BCSD (e.g., Maurer & Hidalgo, 2008 HESS)
Dynamical simulation for downscaling Global Model Regional Climate Model
Winds Temperatures Vapor Pressure levels Winds Temperatures Vapor Pressure levels Winds Temperatures Vapor Pressure levels Approximately the same physics, dynamics & drivers as in global model Winds Temperatures Vapor Pressure levels
What are you going to use the downscaled scenarios for? Which climate variables/statistics matter most? Do you need daily resolution, daily congruence among climate variable? Monthly? Long-term mean? Is interannual variability important? Is long-term evolution of impacts significant? What spatial resolution do you really need? What resolution do you get by with now? Are key changes really as small scale as all that?
Downscaling the usual variables Temperatures & precipitation Downscaling “other” variables Probable skills: Temperature Humidity Longwave rad Solar rad Precipitation Surface winds Reanalysis: Jan 1 1950 surface humidity Dynamical: CARD10 by Kanamitsu & Kei Statistical: Constructed analogs by Hidalgo et al
Temporal resolution & characteristics: • dT and %P rescaling • Time scales match historical record used • Variability duplicates historical unless shuffled • Interannual etc characteristics can be lost if shuffled • Higher-order statistics duplicate historical • Synthetic statistical • Daily harder to get right than monthly than annual • (especially for precipitation) • Deterministic statistical • Daily is possible if daily GCM output available • Temporal characteristics drawn from GCM • Dynamical simulation • High temporal resolutions • Long-term sequencing from GCM • Higher-order statistics can change in consistent ways • Long scenarios expensive • Model biases still need correction
Downscaled Projected Trends in December Precipitation by Two Approaches (GFDL CM2.1, A2 emissions, 21st Century) Constructed analogs BCSD Bias correction & spatial downscaling, from Ed Maurer, SCU
My downscaling wish list for CASCaDE: -- Resolution: Daily time resolution, ~ 10-km spatial resolution, multiple climate variables -- Accuracy: Reproduction of high-resolution historical records -- Feasibility: Not too computationally burdensome (?) -- Synchronicity: Downscaled weather synchronized with climate model weather (just a Delta SLR-floods thing?) -- Theoretical: Doesn't constrain future higher-order stats to be same as historical -- Aesthetic: Climate (& trends) arise from entire weather field rather than being imposed GCM-grid cell by grid cell -- Practical: Ability to downscale to grids + stations at same time, maintaining internal consistency
Skill of downscaling as indicated by application of method to historical OBSERVATIONS Skill at monthly average scale
Distributions of daily precip at selected sites Application of method to historical OBSERVATIONS shows that even extremes are captured accurately Hidalgo, H.G., Dettinger, M.D., and Cayan, D.R., in review, Downscaling using constructed analogues daily US precipitation and temperatures: J. Climate, 24 p.
Some PROs: dT %P: Easy, know exactly what you changed, realistic variability & geography, no biases Statistical synthesis: Can be easy (not always), draws on best parts of GCMs, computationally quick, multiple realizations, biases handled Deterministic statistical: Computational middle ground, uses variability from GCM (thus can reflect changing climate modes), whole distributions can be preserved (high-order debiasing), realistic geography Dynamical (regional) simulation: Draws large scale variability from GCM, first-principles physics, all variables downscaled
Some CONs: dT %P: No new variability, only minimal info from GCM being used, changes not realistic Statistical synthesis: Difficult to retain spatial & variable inter-relations, climate variability is not really simple noise, some variables purely random Deterministic statistical: Computational middle ground, assumes local climate responses to large-scale climate are stationary, single climate realization Dynamical (regional) simulation: Computationally burdensome, bias correction still needed, relatively short simulations provided
What is in a typical set of downscaled scenarios these days? 1. Projections by multiple climate models 2. Projections under various greenhouse-gas emission scenarios 3. Historical-period simulations for use in calibrations/testing e.g., 1950-99 along with the 21st Century climate projections 4. Daily to monthly time steps (over, say, 150 years) 5. 10- to 12-km spatial resolution (statistical) or 20-30 km (dynamical), regional to continental scales 6. Precipitation & temperatures (just beginning other variables)
Some available downscaled projections: • BCSD—dozens of scenarios at 12 km, monthly • http://gdo-dcp.ucllnl.org/downscaled_cmip3_projections/ • ConstrAnalogs—several scenarios at 12 km, daily • http:// cascade.wr.usgs.gov/data/Task1-climate/ • Numerical regional model projections—multiple models, • not so much off the shelf • http://www.narccap.ucar.edu/ • An upcoming (statistical) downscaling improvement: • BCCA—best of BCSD & CA methods!