Analyzing IQ, Learning Conditions, and Psychological Traits in University Students
This study explores various psychological and cognitive dynamics among university students, including their IQ levels and learning efficiency in different environments. We investigate whether the average IQ of university students exceeds standard norms and analyze gender differences in verbal IQ. Additionally, we assess the impact of auditory distractions on learning effectiveness and the relationship between blood pressure and tolerance levels among different psychological profiles. These inquiries aim to enhance our understanding of student cognition, learning behaviors, and psychological well-being.

Analyzing IQ, Learning Conditions, and Psychological Traits in University Students
E N D
Presentation Transcript
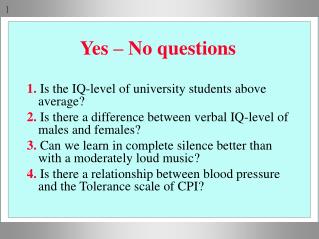
1. Is the IQ-level of university students above average? 2. Is there a difference between verbal IQ-level of males and females? 3. Can we learn in complete silence better than with a moderately loud music? 4. Is there a relationship between blood pressure and the Tolerance scale of CPI? Yes – No questions
X=WAIS-IQ, Population = University students • H0: E(X) = 100 • H1: E(X) < 100 • H2: E(X) > 100 • H0: Med(X) = 100 • H1: Med(X) < 100 • H2: Med(X) > 100 • H0: E(X) = 100 • HA: E(X) 100 • H0: Med(X) = 100 • HA: Med(X) 100
Verbal intelligence: WAIS/VIQ, E(VIQ/female) = fE(VIQ/male) = m • H0: f = m • H1: f < m • H2: f > m • H0: f = m • HA: fm
The above hypotheses always refer to the population characteristics ofthe variables studied (expected value, median,etc.) Only one of them can be true at the same time. H0, thenullhypothesis,can only be true in one single case. Thealternative hipothesescan be true in infinite ways.
What is a statisticaltest? X-sample Statisticaltest Which of them is true? H0 H1 H2
1. Interval estimation for E(X): C0.95 = (c1; c2). Aprocedurefor testing theH0: E(X)=100 hypothesis X 100? 100? 100? c2 c1 2. E(X) is likely between c1and c2. 3. If 100 is also between c1and c2, keep H0. 4. If c2 < 100, accept H1: E(X) < 100. 5. If c1 > 100, accept H2: E(X) > 100.
0.95 0.025 0.025 z test Assumptions: X is normallydistributed, is known H0: E(X) =0 X-sample N(0,1) 0 z = -1.96 1.96 z -1.96 z 1.96 |z| < 1.96 H1: E(X) < 0 H0 H2: E(X) > 0
Testing the H0: E(X)=m0 hypothesis if is unknown If H0: E(X)=m0is true, then the test statistic m0 t = s follows a t distribution withdf = n-1, provided that X is normal, or n is large. Since |t| < t0,05with a probability of 95%, |t| t0,05 is very unlikely. If despite this it occurs, it is an evidence against H0, in which case we reject H0.
. . . -t t 0.05 0.05 One-sample t-test Assumption: X is normal X-sample H0: E(X)=m0 t m0 t = s |t| < t0.05 t -t0.05 t t0.05 H1: E(X) < m0 H0 H2: E(X) > m0
Basic terms of two-tailed tests illustrated with the t-test (level of significance = ) t . . . Region of acceptance -t0.05 t0.05 Critical region Critical region Criticalvalues
Basic terms of one-tailed tests illustrated with the t-test (level of significance = ) t Assumption: H1: E(X) < m0 is equiv. to H0 H0: E(X) = m0 H2: E(X) > m0 . . Region of acceptance t0.10 Critical region Criticalvalue
If we reject H0: Error:false rejection Name of error:Type I error Probability:level ofsignificance (a) Effect:test validity If we keep H0: Error:false acceptance Name of error: Type II error Probability:generally not known (b) Effect:test efficiency Errors in a statistical test
1. Is there any difference between verbal and performance IQ-levels at schizophrenics? 2. Is body temperature larger in the morning than in the evening? 3.Is the tolerance level of neuroticssmaller than that of psychopaths? Comparing two variables or populations
Examples: H0: E(VIQ/Sch) = E(PIQ/Sch) H0: E(Morning temp.) = E(Evening temp.) H0: E(CPI-Tol/Neurot) = E(CPI-Tol/Ppath) Often (if X and Y are quantitative): H0:1 = 2 Comparing two means
Example: comparing VIQ-leveland PIQ-level. Solution: Z = VIQ-PIQ, or (only atratio scaled variables)Z = Y/X New nullhypothesis: H0: E(Z) = 0 orH0: E(Z) = 1 Statisticaltest: one sample t-test. Steps: draw a random sample, compute z-scores, perform one-sample t-test on the Z-sample. Case of one population, twovariables
Example:Comparing verbal IQ of males and females. Nullhypothesis:H0:1 = 2 Sampling:Draw twoindependent samples from the two populations. Comput.:Compute sample means and variances: Sample sizeMean Variance Sample 1: n1 x1 var1= (s1)2 Sample 2: n2 x2 var2= (s2)2 Case of two populations, onevariable
Ifthe H0: 1 = 2 nullhypothesis is true, and X is normal and1 = 2, thenthe The two-sample t-test statisticfollows a t distributionwith df = f1 + f2, wheref1 = n1-1, f2 = n2-1,and
. . . -t t 0.05 0.05 Two-sample t-test Assumptions: normality, independent samples, 1 = 2 H0: 1 = 2 X-sample t t -t0.05 |t| < t0.05 t t0.05 H1: 1 < 2 H2: 1 > 2 H0
If the H0: 1 = 2 nullhypothesis is true and X is normal, then the The Welch-test test statisticfollows approximately a t distribution with the following df(a=Var1/n1, b=Var2/n2):
. . . -t t 0.05 0.05 The Welch-test Assumptions:normality, two independent samples X-sample H0: 1 = 2 t t’ -t0.05 |t’| < t0.05 t’ t0.05 H1: 1 < 2 H2: 1 > 2 H0
Fisher-s F test Assumptions:normality, two independent samples X-sample H0: 1 = 2 F . . F0,025 F < F0.025 FF0.025 H0: 1 = 2 HA: 1 2
The Welch-testis a robust version of the two-sample t-test, because it tests the same null hypothesis with fewer assumptions. Robust versions of the F test(less sensitive to the violation of the normality assumption): Levene-test O’Brien-test Robust statisticaltests