Understanding Earth Geometry and GIS Projections: A Quick Reference Guide
This quick reference guide provides an overview of Earth's geometry, including its shape as an oblate spheroid and diameters at the equator and poles. It covers essential geographic data concepts, including coordinate systems (latitude/longitude and UTM), datums, and projections. Users will also find information on spatial data types, GIS methods, and common GIS software tools. Key best practices for data accuracy and processing are detailed, along with critical points about managing geographic data for effective analysis and visualization in a GIS context.

Understanding Earth Geometry and GIS Projections: A Quick Reference Guide
E N D
Presentation Transcript
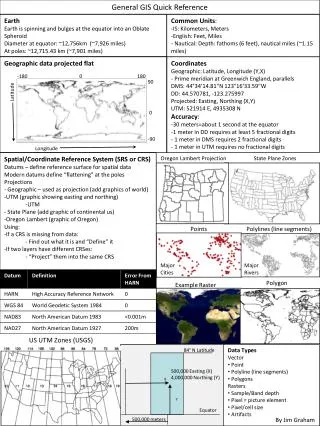
General GIS Quick Reference Earth Earth is spinning and bulges at the equator into an Oblate Spheroid Diameter at equator: ~12,756km (~7,926 miles) At poles: ~12,715.43 km (~7,901 miles) • Common Units: • IS: Kilometers, Meters • English: Feet, Miles • - Nautical: Depth: fathoms (6 feet), nautical miles (~1.15 miles) Geographic data projected flat • Coordinates • Geographic: Latitude, Longitude (Y,X) • - Prime meridian at Greenwich England, parallels • DMS: 44°34′14.81″N 123°16′33.59″W • DD: 44.570781, -123.275997 • Projected: Easting, Northing (X,Y) • UTM: 521914 E, 4935308 N • Accuracy: • 30 meters=about 1 second at the equator • 1 meter in DD requires at least 5 fractional digits • 1 meter in DMS requires 2 fractional digits • 1 meter in UTM requires no fractional digits • Spatial/Coordinate Reference System (SRS or CRS) • Datums – define reference surface for spatial data • Modern datums define “flattening” at the poles • Projections • - Geographic – used as projection (add graphics of world) • UTM (graphic showing easting and northing) • UTM • - State Plane (add graphic of continental us) • Oregon Lambert (graphic of Oregon) • Using: • If a CRS is missing from data: • Find out what it is and “Define” it • If two layers have different CRSes: • “Project” them into the same CRS Oregon Lambert Projection State Plane Zones Points Polylines (line segments) Major Cities Major Rivers Polygon Example Raster US UTM Zones (USGS) • Data Types • Vector • Point • Polyline (line segments) • Polygons • Rasters • Sample/Band depth • Pixel = picture element • Pixel/cell size • Artifacts 84° N Latitude 500,000 Easting (X) 4,000,000 Northing (Y) X Y Equator By Jim Graham 500,000 meters
Concepts: • Resolution/scale/extent • Accuracy& precision, collection & processing effects • Small Scale = large extent (1:250,000 is small scale) • Overall process: acquire, review/prep, assemble, analyze, render, distribute • RS data, derived data • Metadata • Attributes • Value types: String, int, double, dates • Queries and simple calculations • Statistics • GIS Methods: • Digitizing/editing • Rasters: subsample, mosaic/combine, crop, sample type conversions • Vectors: union, intersection, exclusion, merge/dissolve, generalize, buffer, clip • Raster to polygon, contours • Vector to raster: interpolation, point density,, IWD, polygon to raster • Raster math • Histograms, re-class • Simple stats: min, max, mean, mode (pixel, local, zonal) • Common GIS Software • 7-zip: decompress zip, tar, gz files • FWTools: file format conversions • ArcGIS: most popular in US • GRASS: open source • Quantum (or Q) GIS: open source • Google Earth • GIS Programming Languages • Python • Organizations/Datasets • EROS: LandSat, National Atlas • USGS, NOAA, NASA • NLCD, NHD, DRG/24k topo, DEMs • Oregon Geospatial Data Clearinghouse • FGDC, OpenGIS • Cartography • Thematic layers • Symbology: marks, patterns, colors • Labeling: fonts, placement, embellishments • Map Elements: • Title • Legend • North arrow • Description: Author, date, projection, datum, units • Scale (bar or text) • Insets • Rulers • GPS Critical Points: • Don’t change the datum once you’ve collected data • Accuracy changes for each point Footnotes: 1. While popular, these are not really GIS formats 2. Can be internal with GeoTIFF Tags 3. Some metadata can be internal, XML file for full specification 4. GRID has a set of files that include georeferencing and CRS 5. E00 is for interchange. Convert it to a Shapefile or coverage 6. Coverage's are ESRIs old topological vector format 7. TXT typically contain tab-delimited data with the first row as a header 8. CSVs can have problems with text that contain commas Sources: US Geological Survey, NASA’s Blue Marble dataset, NaturalEarth, State of Oregon