Download

1 / 5
50 likes | 160 Vues
Discover the compelling stories behind sports data in this analysis of critical sporting events. Explore the visualization of basketball fourth-quarter performance through made (o) and missed (x) baskets, revealing clutch moments in the game. Dive into the accuracy of a football team’s shots on and off target, highlighting their offensive strategies. Additionally, examine the finishing scores of the top ten athletes in the Olympic heptathlon, showcasing the best in multi-event performance. This data-driven approach sheds light on patterns and insights within sports.

E N D
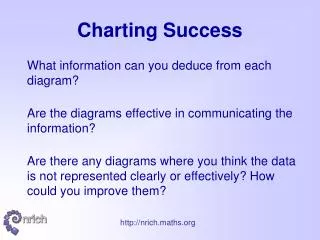
What stories can be told about the sporting events represented in these graphs and diagrams?
Baskets made (o) and missed (x) in the fourth quarter of a basketball match