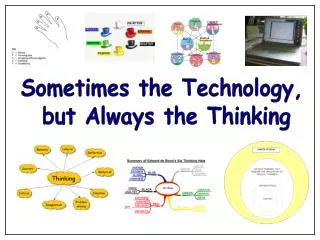
Thinking outside the “Visualization” Box
Thinking outside the “Visualization” Box. Ken Joy Visualization and Graphics Research Group Institute for Data Analysis and Visualization Computer Science Department University of California, Davis. People. Thanks to

Thinking outside the “Visualization” Box
E N D
Presentation Transcript
Thinking outside the “Visualization” Box Ken Joy Visualization and Graphics Research Group Institute for Data Analysis and Visualization Computer Science Department University of California, Davis
People • Thanks to • Ben Gregorski, Chris Co, Serban Porumbescu, Karim Mahrous, Janine Bennett, Lok Hwa, IDAV, UC Davis • Mark Duchaineau, Peter Lindstrom, Valerio Pascucci, LLNL • Josh Senecal, LLNL, Davis • Hans Hagen, Kaiserslautern • Bernd Hamann, UC Davis • Note that the name of our organization has changed.
The Problem This is a portion of an isosurface taken from the final time step of a Richtmeyer-Meshkov instability shock-tube simulation. The simulation was generated on a 2000x2000x2000 grid. An isosurface of 460 million triangles was generated by marching cubes.
Simplification, Wavelets, Subdivision • We simplified the mesh. • We generated a fine mesh from a simplified base mesh using Catmull-Clark subdivision. • Invented new Catmull-Clark wavelets to preserve features. • Lots of publications, …
What did we learn? • We worked on this data set for almost two years, and still didn’t have a interactive “renderable” version. • Occlusion problems were killing us! • Features were disappearing! • …and this was only one isovalue!!! • Data size of this one isosurface exceeded the size of the original data set. • We had to think outside of “Multiresolution Analysis” to find a solution
What did we do? • Dynamic generation of the isosurface. • Dynamic extraction based upon a 3D longest-edge-bisection tetrahedral mesh which is refined and coarsened depending on viewpoint, error, and frame rate. • Algorithm depends on an innovative storage scheme for the multiresolution data, and an occlusion scheme, allowing real-time display of the isosurface.
Results! • Dynamic Isosurface Generation – Gregorski, et al. – IEEE Visualization 2002 • Time-Varying Isosurfaces – Gregorski, et al. – TVCG, 2004 • Compression and Occlusion – Gregorski, et al. – IEEE Visualization 2004, submitted.
Lessons? • We learned that we must think “out of the box” to solve major problems. • Key words: • Large, massive, terascale • Time varying • Interactive, real-time • Time critical • Mathematically sound
Dynamic sensor data! Potentially billions of sensors Sensors are scattered and may move in time.
Problems! • Data is scattered. • Data may move in time. • Applications are time-varying and time-critical. • We cannot afford to generate a mesh for each time step. • Can we develop visualization methods that do not depend on a fixed mesh?
“Meshless” Isosurfaces “Isosplatting”, Co, et al., 2003
“Meshless” Isosurfaces “Isosplatting”, Co, et al., 2003
“Meshless” Isosurfaces • Solves the multi-block isosurface problem • i.e., no cracks. Co, et al., VisSym 2004
Lessons? • Many “mesh” problems can be solved by “meshless” techniques. • Instead of one algorithm for each mesh type… • Thinking outside the “mesh”
Thinking Outside the “Visualization” Box • Perhaps innovation in visualization can best be achieved by “Thinking outside the box”. • In our research, we frequently think “inside”, working on the little problems that improve the existing algorithms. • What about “new” algorithms, “new” techniques, “new” approaches?
Think outside the “Multiresolution” box • Think outside “subdivision,” “wavelets”, “splines”, “mesh simplification,” etc. • "The key to terascale visualization is deciding what to visualize." • The key is to focus the data exploration, not to show absolutely everything. • Queries on Scientific Data Sets. • Find those regions of interest to the user. • Carr, Banff 2004 – Volumetric Queries
Think outside the “Mesh” • Perhaps think “Meshless” • Solves many problems!
Think outside the “Big Three” • Are there other “fundamental” visualization algorithms besides Slicing, Isosurfaces, and Volume Rendering for scalar fields
Segmentation Techniques Nielson and Franke, IEEE Visualization 1997 Bonnell, et al., IEEE Visualization 2000, TVCG 2003. Mahrous, et al. TVCG 2004.
Think outside the “Heuristic” • Edelsbrunner Corollary (Banff, 2004) • Work in the “sunshine!” • Work in the world of theorems. Theorems require deeper thinking about the subject and can show ways to get out of the box. • Corollary: Think outside “linear”
Think outside the “Scalar Field” • Vector Fields • Tensor Fields • DT-MRI – Can we work with the “original” data? • Multi-valued Fields • Distributions at each data point • Air Quality Problems • Radiation Transport Simulations • Distributions at each data point • Vector distribution at each data point • Tensor distribution at each data point
Think outside “2D” • Three-dimensional time-varying multivalued data exploration is HARD. Let’s focus our activities there. • What are separatrices in 3-dimensional vector fields? • What are the topological properties of a 3-dimensional tensor field?
Think outside “Static” • The problems of the world are not static problems! • Blood flow cannot be stopped during an MRI (on a human, at least) • Time-varying Data • Time Critical Data • User-controlled visualizations.
Think outside “SciVis” and “InfoVis” • Isn’t SciVis just InfoVis with spatial location? • Focus + Context in SciVis?
Think outside the “Pretty Picture” • AARGH!!! • “It looks good this way” • “Pleasing to my eye” • “Color scheme implies nothing!” • I believe that our field should be called “Data Exploration” • “Does it convey the correct information?” • “Is it right?” (Mike Kirby)
Think outside the “GPU” • Programming the GPU is “Research in Programming”
Think outside the “Academic Problem” • Hitching our research to someone else’s driving {application} and solving those problems on the owners’ terms, leads us to richer {visualization} research. (Fred Brooks, 1996) • “Visualization is 40 papers per year.” (Banks, Banff 2004) Therefore, since 1990, the visualization field consists of approximately 550 papers. • Where are our “clients”? (Lorensen, 2003) • Is visualization a “relevant” field?
Ken’s Eleven • Think outside the “Multiresolution” box • Think outside the “Mesh” • Think outside the “Big Three” • Think outside the “Heuristic” • Think outside the “Scalar Field” • Think outside “2D” • Think outside “Static” • Think outside “SciVis” and “InfoVis” • Think outside the “Pretty Picture” • Think outside the “GPU” • Think outside the “Academic Problems”
HELP ME! • Where do we need to think “outside the box”? • What are the “right” questions to ask?
Thank You joy@cs.ucdavis.edu http://graphics.cs.ucdavis.edu/~joy