Download
1 / 20
210 likes | 234 Vues
Explore the causes and categorization of failures in the Public Switched Telephone Network (PSTN) based on human errors, hardware failures, software issues, overloads, vandalism, and acts of nature. Learn about outage breakdown, measuring availability metrics, and trends in customer minutes. References from IEEE and FCC data included.

E N D
Sources of Failure in the Public Switched Telephone Network BY RAGHU SUNDEEP.T EE 585: Fault Tolerant
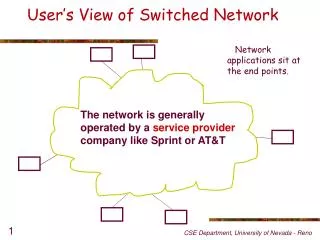
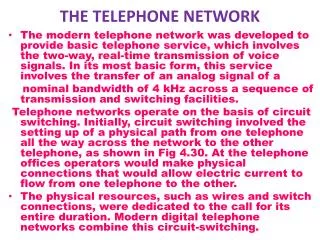
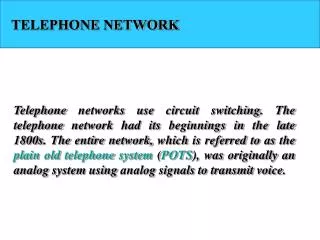
DESCRIPTION • Like all telephone switching networks, the PSTN performs a fairly simple task: It connects point A with point B. • The PSTN contains thousands of switches • Switches include redundant hardware and extensive self-checking and recovery software • The PSTN is a large, complex, distributed system with strong dependability guarantees.
A Layout Of PSTN DLSU (Digital Local Switching Unit) DLE (Digital Local Exchange) DCCE (Digital Cell Centre Exchange) DMSU's (Digital Main Switching Unit)
Failure Analysis of the PSTN: 2000Approach • Find the areas that are failing then try to fix/address the problems • Use PSTN as a case study for ROC: • Large, widely used, networked system • Highly reliable infrastructure • Provides an upper limit for reliable computer service • BEST CASE
Collecting Failure Data • Target System: US Public Switched Telephone Network (PSTN) • Detailed telephone service failure data available from the Federal Communications Commission (FCC) • Telephone Disruption reports: company name, duration, time, cause, and event disruption • Required by law for outages affecting 30,000 people or lasting at least 30 minutes
Causes of Failure • Human Error • Acts of Nature • Hardware Failure • Software Failure • Call overloads • Vandalism
Categorizing the Failures • Human Error • Company workers • Includes Contractors and Vendors • External • Acts of Nature • Fire • Rain • Lightning • Winds • Floods
Categorizing the Failures • Hardware Failure • Network component failure • Cable, power outage • Software Failure • corrupt/incorrect communication software • Call Overloads • Over network capacity • Vandalism • Intentional harm to telephone network equipment
Categorization Challenges • Outages may have multiple causes • Terminology • Root Cause - cause behind the outage • Direct Cause - immediate trigger • i.e. • Root Cause – latent error in software • Direct Cause – Maintenance error (human)
Human-company Human-external Hardware Failure Software Failure Overload Vandalism Acts of Nature Outages Breakdown by Number: Human Error accounts for 55% of the outages for 2000 Total: 202 outages *Vandalism accounts for < 1%
Human-company Human-external Hardware Failure Software Failure Overload Vandalism Outage Breakdown by Number (Nature Factored Out) Human Error accounts for 59% of all Outages Total: 187 outages
What could humans possibly do wrong? • Cut incorrect cables • Upgrade software incorrectly • Incorrectly repair hardware • Follow instructions incorrectly • Fail to read documentation • Do things out of order
Measuring Availability • Number of Outages • Only measures the number of outages. • Does not include the duration of the outages. • There’s more important information than simply the number of outages. • Outage Duration • Customers Affected • Blocked Calls
A Second Metric • Customer Minutes • Outage duration in Minutes * Customers affected • Captures collective customer experience • Assumes all affected customers or lines attempted to make a call
Number of Outages vs. Customer Minutes Humans = 54% Total: about 95 Million customer minutes/year Total: 187 outages
Summary: • Humans were the greatest cause of failure. • Humans caused most of the outages “Traditional Computing concentrates on tolerating hardware and operating system faults, ignoring faults by human operators…” (David Patterson, 2001)
Future Work: • Directly apply data to the ROC project • Could the ROC techniques have avoided these outages? • Further categorize the data • More specific categories within each general category • Telephone Company • Geographic location • Breakdown Human error further • Vendors, contractors, technicians, outsiders… • Include more years of outages for further comparison
REFERENCES • From IEEE Computer, Vol. 30, No. 4 (April, 1997). • Kühn, DR: Sources of Failure in the Public Switched Telephone Network, IEEE Computer (April 1997) • www.flashsear.net/fs/prof/papers/shaman02.pdf • DATA available from FCC