Download
1 / 24
240 likes | 258 Vues
Empirical Evaluation of Shared Parallel Execution on Independently Scheduled Clusters. Mala Ghanesh Satish Kumar Jaspal Subhlok University of Houston CCGrid, May 2005. Scheduling Parallel Threads. Space Sharing/Gang Scheduling

E N D
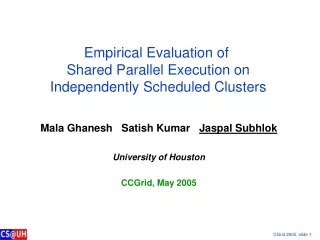
Empirical Evaluation of Shared Parallel Execution on Independently Scheduled Clusters Mala Ghanesh Satish Kumar Jaspal Subhlok University of Houston CCGrid, May 2005
Scheduling Parallel Threads Space Sharing/Gang Scheduling • All parallel threads of an application scheduled together by a global scheduler Independent Scheduling • Threads scheduled independently on each node of a parallel system by the local scheduler
a1 a2 a3 a4 a1 a2 a3 a4 b1 b2 b3 b4 a1 a2 a3 a4 a1 a2 a3 a4 a1 a2 a3 a4 b1 b2 b3 b4 b1 b2 b3 b4 a1 a2 a3 a4 b1 b2 b3 b4 b1 b2 b3 b4 b1 b2 b3 b4 Space Sharing and Gang Scheduling Nodes Space sharing Gang scheduling N1 N2 N3 N4 N1 N2 N3 N4 T1 T2 T3 T4 T5 T6 T1 T2 T3 T4 T5 T6 Time slice Threads of application A are a1, a2, a3, a4 Threads of application B are b1, b2, b3, b4
a1 a2 b3 a4 a1 a2 a3 a4 b1b2b3a4 b1 b2 b3 b4 a1 a2 a3 a4 a1 a2 a3 a4 b1 b2a3b4 b1 b2 b3 b4 a1 a2 a3 a4 a1a2b3 b4 b1 b2a3 b4 b1 b2 b3 b4 Independent Scheduling and Gang Scheduling Nodes Independent Scheduling Gang scheduling N1 N2 N3 N4 N1 N2 N3 N4 T1 T2 T3 T4 T5 T6 T1 T2 T3 T4 T5 T6 Time slice
Gang versus Independent Scheduling Gang scheduling is de-facto standard for parallel computation clusters How does independent scheduling compare ? + More flexible – no central scheduler required + Potentially uses resources more efficiently - Potentially increases synchronization overhead
a1 a2b3b4 b1b2a3a4 a1 a2b3b4 b1b2a3a4 a1a2b3 b4 b1b2a3 a4 Synchronization/Communication with Independent Scheduling Nodes With strict independent round robin scheduling parallel threads may never be able to communicate! Fortunately scheduling is never strictly round robin, but this is a significant performance issue N1 N2 N3 N4 T1 T2 T3 T4 T5 T6 Time slice
Research in This Paper How does node sharing with independent scheduling perform in practice ? • Improved resource utilization versus higher synchronization overhead ? • Dependence on application characteristics ? • Dependence on CPU time slice values ?
Experiments All experiments with NAS benchmarks on 2 clusters Benchmark programs executed: • Dedicated mode on a cluster • With node sharing with competing applications • Slowdown due to sharing analyzed Above experiments conducted with • Various node and thread counts • Various CPU time slice values
Experimental Setup • Two clusters are used: • 10 node, 1 GB RAM, dual Pentium Xeon processors, RedHat Linux 7.2, GigE interconnect • 18 node 1 GB RAM, dual AMD Athlon processors, RedHat Linux 7.3, GigE interconnect • NAS Parallel Benchmarks 2.3, Class B MPI Versions • CG, EP, IS, LU, MP compiled for 4, 8,16, 32 threads • SP and BT compiled for 4, 9, 16, 36 threads • IS (Integer Sort) and CG (Conjugate Gradient) are most communication intensive benchmarks. • EP(Embarassingly Parallel) has no communication.
Experimental # 1 • NAS Benchmarks compiled for 4, 8/9 and 16 threads • Benchmarks first executed in dedicated mode with one thread per node • Then executed with 2 additional competing threads on each node • Each node has 2 CPUs – minimum 3 total threads are needed to cause contention • Competing load threads are simple compute loops with no communication • Slowdown (%age increase in execution time) plotted • Nominal slowdown is 50% - used for comparison as gang scheduling slowdown
Results: 10 node cluster 4 nodes 80 Expected slowdown with gang scheduling 8/9 nodes 70 60 50 Percentage Slowdown 40 30 20 10 0 CG EP IS LU MG SP BT Avg Benchmark • Slowdown ranges around 50% • Some increase in slowdown going from 4 to 8 nodes
Slowdown Results: 18 node cluster • Broadly similar • Slow increase in slowdown from 4 to 16 nodes
Remarks • Why is slowdown not much higher ? • Scheduling is not strict round robin – a blocked application thread will get scheduled again on message arrival • leads to self synchronization - threads of the same application across nodes get scheduled together • Applications often have significant wait times that are used by competing applications with sharing • Increase in slowdown with more nodes is expected as communication operations are more complex • The rate of increase is modest
Experiment # 2 • Similar to the previous batch of experiments, except… • 2 Application threads per node • 1 load thread per node • Nominal slowdown is still 50%
Performance: 1 and 2 app threads/node 1 app thread per node, 4 nodes 2 app threads per node, 4/5 nodes 1 app thread per node, 8/9 nodes 2 app threads per node, 8 nodes 80 Expected slowdown with gang scheduling 70 60 50 Percentage Slowdown 40 30 20 10 0 CG EP IS LU MG SP BT Avg Slowdown is lower for 2 threads/node
Performance: 1 and 2 app threads/node 1 app thread per node, 4 nodes 2 app threads per node, 4/5 nodes 1 app thread per node, 8/9 nodes 2 app threads per node, 8 nodes 80 70 60 50 Percentage Slowdown 40 30 20 10 0 CG EP IS LU MG SP BT Avg • Slowdown is lower for 2 threads/node • competing with one 100% compute thread (not 2) • scaling a fixed size problem to more threads means each thread uses CPU less efficiently • hence more free cycles available
Experiment # 3 • Similar to the previous batch of experiments, except… • CPU time slice quantum varied from 30 to 200 ms. • (default was 50 msecs) • CPU time slice quantum is the amount of time a process gets when others are waiting in ready queue • Intuitively, longer time slice quantum means • a communication operation between nodes is less likely to be interrupted due to swapping – good • a node may have to wait longer for a peer to be scheduled, before communicating - bad
CPU time slice=30 ms CPU time slice=100 ms 100 CPU time slice=50 ms CPU time slice=200 ms 90 80 70 60 Percentage Slowdown 50 40 30 20 10 0 CG EP IS LU MG SP BT Performance with different CPU time slice quanta • Small time slices are uniformly bad • Medium time slices (50 ms and 100 ms) generally good • Longer time slice good for communication intensive codes
Conclusions • Performance with independent scheduling competitive with gang scheduling for small clusters. • Key is passive self synchronization of application threads across the cluster • Steady but slow increase in slowdown with larger number of nodes • Given the flexibility of independent scheduling, it may be a good choice for some scenarios
Model Data Sim 2 Vis Sim 1 Pre Stream Broader Picture: Distributed Applications on Networks: Resource selection, Mapping, Adapting Which nodes offer best performance ? Application Network
End of Talk! FOR MORE INFORMATION: www.cs.uh.edu/~jaspaljaspal@uh.edu
Model Data Sim 2 Vis Sim 1 Pre Stream Mapping Distributed Applications on Networks: “state of the art” Mapping for Best Performance • 1. Measure and model network properties, such as available bandwidth and CPU loads (with tools like NWS, Remos) • Find “best” nodes for execution based on network status • But the approach has significant limitations… • Knowing network status is not the same as knowing how an application will perform • Frequent measurements are expensive, less frequent measurements mean stale data
Discovered Communication Structure of NAS Benchmarks 1 1 1 0 0 0 2 2 3 3 3 2 BT CG IS 1 1 1 0 0 0 2 2 2 3 3 3 LU MG SP 1 0 2 3 EP