
Relevance Network Analysis of TCs: Correlation Coefficients and Introgression Mapping
This supplementary figure presents a relevance network analysis where TCs (Trait Components) are depicted as nodes connected by edges representing their correlation coefficients. Red links indicate positive correlations while blue links signify negative correlations. Additionally, TCs are mapped onto the introgression, showcasing their distribution across different chromosomes. This analysis helps in understanding the interrelationships between various TCs and their potential implications in genetic studies.

Relevance Network Analysis of TCs: Correlation Coefficients and Introgression Mapping
E N D
Presentation Transcript
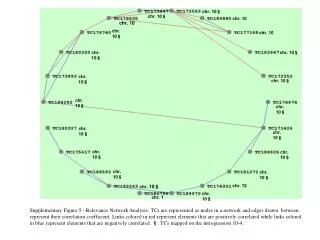
chr. 10§ chr. 10§ chr. 10 chr.10 chr. 10§ chr. 10 chr. 10§ chr. 10§ chr. 10§ chr. 10§ chr. 10§ chr. 10§ chr. 10§ chr. 10§ chr. 10§ chr. 10§ chr. 10§ chr. 10§ Supplementary Figure 5 - Relevance Network Analysis: TCs are represented as nodes in a network and edges drawn between represent their correlation coefficient. Links colored in red represent elements that are positively correlated while links colored in blue represent elements that are negatively correlated. §: TCs mapped on the introgression 10-4. chr. 12 chr. 10§ chr. 10§ chr. 1