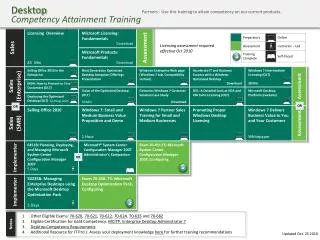
Efficient Energy Management Training for Desktop Operations
Learn about Measurement and Verification (M&V), essential for energy savings in facilities. Understand M&V process, roles, benefits, and stakeholders involved. Explore methods, activities, and resources for effective M&V implementation.

Efficient Energy Management Training for Desktop Operations
E N D
Presentation Transcript
Background • EEDSM Hub, CNES History and Achievements • Herman Carstens, UP M&V Team • Agenda
Introduction • What is M&V? • Why do we do M&V? • Who does M&V? • When does the M&V Team get involved? • How is M&V done?
What is M&V? Measurement and Verification engineering can be thought of as an audit of the energy savings achieved by an ESCo (Energy Services Company) at a client’s facility. M&V is the process by which energy savings from energy efficiency and load management projects are independently and reliably quantified
Basic requirements for M&V • accurate • complete • conservative • consistent • transparent
Why do M&V?Benefits • Ensures sustainability of savings and efficacy of projects • Protects the interests of all stakeholders and help avoid disputes (impartiality) • Helps identify focus areas and opportunities for EEDSM activities and encourages investment • Improve design, performance and maintenance of ESM’s and management of energy budgets • Educate facility users about their energy impacts • Reduces capital expenditure of Eskom
Who does M&V? • Currently, universities: UP, UCT, SU, NWU, UJ, Fort Hare and TUT • In future, SANAS accredited bodies will be able to do M&V.
How is M&V done? By conservatively verifying the true savings achieved in a programme, using established measurement and calculation methods, and applying them in a transparent way.
M&V Activities (from IPMVP) Measurement • Meter installation, calibration and maintenance • Data gathering and screening • Development of acceptable baseline computation methods and estimates. • Computations with measured data Verification • Reporting, quality assurance, and objective verification of reports.
‘Measuring’ savings • Energy savings cannot be directly measured, as it is the absence or reduction of energy use. • Therefore energy saving is determined by measuring the energy use before and after implementation, with adjustments for changing conditions (independent variables and energy governing factors, e.g. temperature, production). • M&V cost < 10% of monetary savings (IPMVP)
CFL Compact Fluorescent Light bulb. “Energy Saver” light bulbs used to replace standard filament (incandescent) bulbs.
Power and Energy • Power: W, kW, MW P = i2R • Energy: Power x time: kWh, MWh E = Pt http://xkcd.com/643/
EE Energy Efficiency. EE devices use less energy than older equipment would have used to perform the same tasks . CFL’s are the most famous example, but various EE devices are installed by ESCo’s for both EE and DSM purposes, as they lower peak demand.
DSM Demand Side Management. This usually entails shifting electricity usage to more cost-effective times (off-peak times), rather than reducing electricity usage. Peak times are considered to be 07:00-10:00 and 18:00-20:00 on the Eskom Megaflex billing scheme. See pp.51, 212 of Measurement and Verification Practices Source: Eskom Tariffs & Charges Booklet 2012/13
ESM (ECM) Energy Savings Measure or Energy Conservation Measure. For example: • Hardware: Lights, Showerheads, Geysers, • Software: Control systems for industrial cooling equipment • Behavioural changes: Load shifting software, awareness programmes, demand response management
ESCo Energy Services Company. The company doing the implementation of the EE and DSM measures on behalf of the facility or company
Energy Governing Factors A.k.a parameters, input variables. These can be static factors or independent variables.
Independent variable A parameter that changes regularly and has a measurable impact on savings – SANS 50010 i.e., variables that are dynamic • Daily temperature changes (dry bulb outdoor), • Production volume: Number of units produced (may also be taken as a static factor for steady production runs) • Instantaneous occupancy
Static Factor A parameter that stays constant during the measurement period A change in a static factor usually means that a non-routine adjustment should be made. • Room size • Types and number/volume of products produced per day, • Working pressure of pneumatic equipment, • Raw material used, • Building envelope characteristics (insulation of windows/doors/ceilings, air tightness), • Amount, type and use of the facility’s equipment, • Environmental standards pertaining to lighting, air flow, and occupancy type, density and schedule (room occupancy, occupancy hours, restaurant meal sales, number of shifts). • Average occupancy
Baseline and adjusted baseline Baseline: Pre-implementation energy use. Adjusted baseline: What the baseline would have been during the reporting period without the ESM’s (taking changing energy governing factors into account, i.e. Changing parameters in the baseline model.)
Reporting Period (RP) (Post-implementation period) The time after the ECM’s have been implemented and reporting is done on the savings actualised by the ECM’s The reporting period can be divided into small intervals, and the savings reported for each sub-RP.
Actual Savings vs. Reported Savings Actual saving: Perfect measurement equipment, Perfect adjustments. A theoretical value. Reported saving: Limited by cost and practicality. E.g., data logger may only record measurement on an hourly basis with a 5% accuracy. Reported saving < Actual saving.
Facility A building, factory, wing of a building, or any site that contains multiple energy systems (consuming equipments) and can be isolated for M&V purposes.
C.O.P. Coefficient of Performance. The efficiency of a cooling system. If a cooling system has a C.O.P. of 5, it can do 5kW of cooling whilst consuming 1kW of electricity. 6kW 5kW 1kW
Degree day 1 cooling degree day (CDD) is a day where the daily mean temperature is 1° higher than the comfortable temperature, therefore requiring 1° of cooling. -2 cooling degree days is where the daily mean temperature is 2° lower than the comfortable temperature for one day, or 1° lower for two days. Note: be careful of US / Imperial Units, e.g. °F.
Estimations Values derived from historical data or engineering judgement, not measured directly but checked for credibility. e.g. CFL wattage is usually estimated.
Measurement Boundary A notional boundary drawn around equipment and/or systems to segregate those which are relevant to savings determination from those which are not. -IPMVP
Interactive effects Energy consumption changes outside the measurement boundary as a result of activities within the measurement boundary. E.g. Reduction in cooling load (not measured) due to replacement of incandescent light bulbs with CFL’s, which generate less heat.
Proxy A measured parameter substituted in the place of a direct energy consumption measurement. “Even a thermometer, after all, is ultimately a model; it measures not temperature but volume of mercury.” Michael Tobis
Measurement Overview • Introduction • Where and what to measure: spatial boundaries • When to measure: periods • How to measure: techniques, equipment • How often to measure: frequency (time / longitudinal studies)
Measurement Introduction • Measurement equipment carefully selected • Measurement done separately where feasible, combined during calculation • Meter accuracy should be noted.
Where and what to measure: boundaries • Depends on methodology employed • Boundaries stay constant between baseline and reporting periods • Energy flows across boundaries should be considered • Meters placed at boundary for retrofit isolation (§5.1.2). However, not always true • Boundaries limit scope of adjustments
Where and what to measure: boundaries Calibrated Simulation Retrofit Isolation Whole-facility measurement
Case Study: EE Computers A client replaces 200 computers with 300 new, EE computers.
What questions should you be asking to define the project fully? What is the project definition / scope? • This will determine where to draw the measurement boundary.
Measurement boundaries • Whole facility • Baseline: 200. Reporting Period: 300 • Retrofit Isolation • Baseline: 200. Reporting period: 200