Download
1 / 20
200 likes | 308 Vues
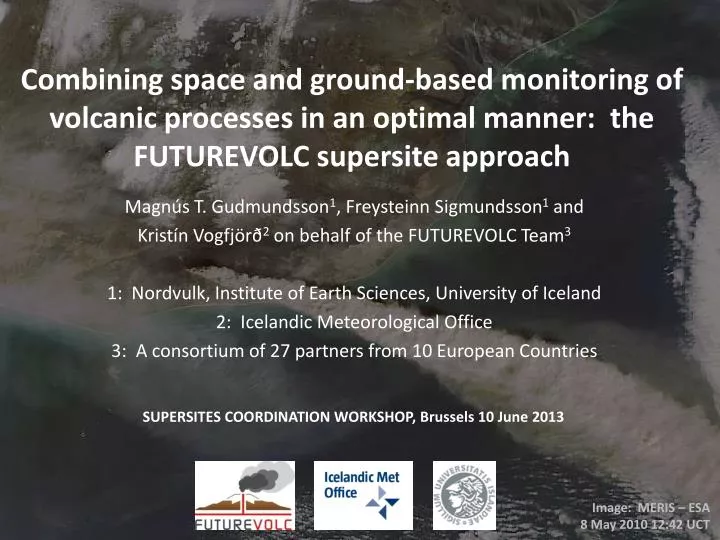
Combining space and ground-based monitoring of volcanic processes in an optimal manner: the FUTUREVOLC supersite approach. Magnús T. Gudmundsson 1 , Freysteinn Sigmundsson 1 and Kristín Vogfjörð 2 on behalf of the FUTUREVOLC Team 3

E N D
Combining space and ground-based monitoring of volcanic processes in an optimal manner: the FUTUREVOLC supersite approach Magnús T. Gudmundsson1, Freysteinn Sigmundsson1 and Kristín Vogfjörð2 on behalf of the FUTUREVOLC Team3 1: Nordvulk, Institute of Earth Sciences, University of Iceland 2: Icelandic Meteorological Office 3: A consortium of 27 partners from 10 European Countries SUPERSITES COORDINATION WORKSHOP, Brussels 10 June 2013 Image: MERIS – ESA 8 May 2010 12:42 UCT
The problem: Real time estimates of mass eruption rate (MER) have high uncertainty • Why this matters for icelandic volcanoes • Examples of the problem – from Eyjafjallajökull 2010 • The Futurevolc approach to reducing the uncertainties
Hekla Katla Ljósm: Sæmundur Þórðarson Eyjafjallajökull Vestmannaeyjar A1 Ljósm: Sig. Þór.
Iceland: Volcanic systems and central volcanoes Grímsvötn Hekla Katla About 30 eruptions per 100 years A2 Eyjafjallajökull
Volcanic eruptions in Iceland in the last 100 years Red = Explosive Black = Effusive Blue = Subglacial Year Volcano VEI note style of activity Grímsvötn 4 ice explosive Eyjafjallajökull 3 ice explosive/effusive 2004 Grímsvötn 3 ice explosive Hekla 3 effusive/explosive Grímsvötn 3 ice explosive Gjálp (Grímsvötn) 2 ice subglacial-explosive Hekla 3 effusive/explosive 1983 Grímsvötn 2 ice explosive 1980-81 Hekla 3 effusive/explosive 1975-84 Krafla fires (9 eruptions) 1 effusive Heimaey 2 effusive/explosive Hekla 3 effusive/explosive 1963-67 Surtsey 3 ocean explosive/effusive Askja 2 effusive 1947-48 Hekla 4 effusive/explosive Gjálp (Grímsvötn) - ice subglacial Grímsvötn 3 ice explosive 1922-29 Askja (5-6 eruptions) 2 (lake) effusive/explosive Grímsvötn 3 ice explosive Katla 4 ice explosive 1913 Hekla 1 effusive A3
Major eruptions in Iceland since settlement year Lava Tephra km3 km3 Vatnaöldur 870 0 3,3 Eldgjá 934 18 5 Hallmundarhraun ~950 8 0 Hekla 11040,5 2,5 Frambruni before 1200 4 0 Öræfajökull 13620 10 Veiðivötn 1480 0,4 ~10 Katla 1755 0 1,5 Laki eruption 1783 10-14 0,8 Askja 1875~0 2,5 Red: North or west IcelandBlue: Eastern Volcanic Zone No major eruption since the 19th century! A4 Based mainly on Thordarson and Larsen (2007), Thorarinsson (1958), Larsen (1984)
Main producers of tephra and jökulhlaups (floods) – the ice covered volcanoes A: Northwest Vatnajökull Kverkfjöll pre-historic jökulhlaups Bárðarbunga Source of catastrophic volcanogenic jökulhlaups in early to mid Holocene Vatnajökull Skaftárkatlar Geothermal areas source of regular jökulhlaups Grímsvötn Over 60 eruptions in last 800 years Source of jökulhlaups 10 km A5 ASTER
B: The volcanoes of south Iceland Hekla - 18 eruptions since 1104 Eldgjá 19 km3 eruption in ~934 AD Eyjafjallajökull 920 1612 1821-23 2010 Katla 20 eruptions in last 1100 years Last eruption in 1918 Source of major jökuhlaups 10 km A6 ASTER
Explosive eruptions in Iceland since 850 AD Towards Arctic 20-25 eruptions/100 years with explosive phases generating tephra (ash) layers Most layers small <<0.1 km3 Distribution: Tendency for transport towards southeast, east and northeast Towards Europe A7 From Larsen and Eiríksson (2008)
Eyjafjallajökull 2010: Phases: I II III IV Total magma 1011 kg Tephra 3.8 Water- transported 0.4 Lava 0.6 __________________ Total 4.8 ================== About 0.18 km3 DRE A8 Gudmundsson et al. 2012
Explosive eruptions: • Produce ash that can be transported long distances • 20-25 explosive eruptions per century • Majority only affect Iceland • Threat to aircraft • Ash reaches Europe on average four times/century (may be an underestimate) • Examples: • Askja 1875 • Hekla 1947 • Eyjafjallajökull 2010 • Grímsvötn 2011 Eyjafjallajökull eruption – April-May 2010 A9 Compiled by Fred Prata, NILU
Challenges in eruption source magnitude determination Eruption rate – example of Eyjafjallajökull 2010 Method MER (kg/s) Reference _______________________________________________________________ Ground sampling 0.5-1 x 10⁶ Gudmundsson et al. (2012) + simple plume model Plume model (wind effect) >1 x 10⁷ Bursik et al. (2012) Plume model (wind effect) 5-9 x 10⁶ Woodhouse et al. (2012) _______________________________________________________________ Mapping of mass of erupted material does not support the high eruption rates B1 Photo: Þórdís Högnadóttir, 4 May 2010
Challenges in eruption source magnitude determination Magnitudes of <30 µm ash emitted from volcano Method mass of <30µm Reference _______________________________________________________________ Ground sampling + 80 Tg Gudmundsson et al. (2012) grain size distributions Satellite derived 8 Tg Stoll et al., (2011) Schumann et al. (2011) ______________________________________________________________ An order of magnitude discrepancy 17 B2 May 8 2010 48/60
FUTUREVOLC approach – better and faster estimates of ongoing processes – before eruptions and during eruptions • Long term magma tracking • Imminent eruptive activity, eruption onset and early warning • Determination and evolution or eruption source parameters • In real-time or near real-time provide quantiative estimates of mass eruption rate • Fast delivery of composition, grain size distribution and volatile emission • Explosive, effusive and subglacial eruptions • Distribution and description of eruptive products • Fast quantitative information on atmospheric ash and sulphur dioxide concentrations in near and far field C1
Futurevolc: Sensors, types of volcanic eruptions, and contribution to multi-parameter system for near real time determination of eruption source parameters. C2
Futurevolc plan for observations of plumes – determination of MER In near real time C3
Airborne observations - SAR radar – comparison with photo 17 April 2010, 11:28 18 April 2010, 13:06 SAR 4 km • Airborne observations: • Visual observations • SAR radar – clouds and plume transparent • Infrared cameras 15-30 km C4 From Magnússon et al. 2012
Multi-parameter system estimating mass eruption rate using data from all sensors C5
Ash transport for long distances – FUTUREVOLC enhancement: • Satellite data: • Visual • Infrared – attenuation of thermal radiation from earth‘s surface • Used to update – starting from estimated MER C6
Summary • There is strong need for better and faster estimates of eruption source parameters and mass concentrations of ash in atmosphere during eruptions • The FUTUREVOLC Approach: • Interdisciplinary – multi-component bringing together physical volcanologists, geophysicists, geochemists and atmospheric scientists • Provide a fast automated system for MER, based on a large variety of sensors • Use well-tested methods together with new approaches • Innovation with development of new sensors • System tested with synthetic data – or a real eruption


![[1] P. Schobinger-Papamantellos et al. J. Magn. Magn. Mater. 169 (1997), 253](https://cdn3.slideserve.com/5865661/slide1-dt.jpg)