Download
1 / 35
351 likes | 515 Vues
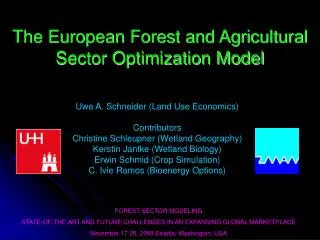
The European Forest and Agricultural Sector Optimization Model. Uwe A. Schneider (Land Use Economics) Contributors Christine Schleupner (Wetland Geography) Kerstin Jantke (Wetland Biology) Erwin Schmid (Crop Simulation) C. Ivie Ramos (Bioenergy Options). FOREST SECTOR MODELING

E N D
The European Forest and Agricultural Sector Optimization Model Uwe A. Schneider (Land Use Economics) Contributors Christine Schleupner (Wetland Geography) Kerstin Jantke (Wetland Biology) Erwin Schmid (Crop Simulation) C. Ivie Ramos (Bioenergy Options) FOREST SECTOR MODELING STATE-OF-THE-ART AND FUTURE CHALLENGES IN AN EXPANDING GLOBAL MARKETPLACE November 17-20, 2008 Seattle, Washington, USA
EUFASOM Characteristics • Partial Equilibrium, Bottom-Up Model • Maximizes sum of consumer and producer surplus • Constrained by resource endowments, technologies, policies • Spatially explicit, discrete dynamic • Integrates environmental effects • Programmed in GAMS, Solved as LP
Bioenergy Biomaterial Food Timber Fiber Land use competition Nature Reserves Carbon Sinks Sealed Land
EUFASOM Structure Limits Limits Resources Land Use Technologies Products Markets Inputs Demand Functions, Trade Processing Technologies Environmental Impacts Supply Functions Limits
CS PS Economic Surplus Maximization Land Supply Forest Inventory Processing Demand Water Supply Domestic Demand Labor Supply Market Equilibrium Feed Demand Export Demand Import Supply National Inputs
EUFASOM Modeling System Climate Models Farm level & GIS Data Viable Population Analysis Spatial Analysis Tools Engineering Equations Crop & Tree Simulation Models Systematic Wetland Conservation Planning EUFASOM Other Economic Models
Novel Features • Biodiversity (Wetlands) • Markov Chains (against curse of dimensionality)
Wetland Biodiversity Species Conservation Targets Physical Wetland Potentials Systematic Conservation Planning Land Prices Reserve Locations EUFASOM
Peatland (Fens, Bogs) Marshes, Reeds, Sedges Open Waters Wetforests
Existing Wetlands Potential Wetlands Open Waters
8 BiodiversityScope 69 Vertebrate Wetland Species
Birds Mammals 4 5 2 7 6 12 13 2 14 3 15 8 16 11 1 1 18 21 4 22 9 17 5 10 3 19 23 25 • Acrocephalus paludicola Aquatic Warbler Seggenrohrsänger • Alcedo atthis Kingfisher Eisvogel • Anser erythropus Lesser White-fronted Goose Zwerggans • Aquila chrysaetos Golden Eagle Steinadler • Aquila clanga Spotted Eagle Schelladler • Ardeapurpurea purpurea Purple Heron Purpurreiher • Ardeola ralloides Squacco Heron Rallenreiher • Asio flammeus Short-eared Owl Sumpfohreule • Aythya nyroca Ferruginous Duck Moorente • Botaurus stellaris stellaris Bittern Rohrdommel • Chlidonias hybridus Whiskered Tern Weißbartseeschwalbe • Chlidonias niger Black Tern Trauerseeschwalbe • Ciconia ciconia White Stork Weißstorch • Ciconia nigra Black Stork Schwarzstorch • Crex crex Corncrake Wachtelkönig • Fulica cristata Crested Coot Kammbläßhuhn • Gavia arctica Black-throated Diver Prachttaucher • Gelochelidon nilotica Gull-billed Tern Lachseeschwalbe • Glareola pratincola Collared Pratincole Brachschwalbe • Grus grus Crane Kranich • Haliaeetus albicilla White-tailed Eagle Seeadler • Hoplopterus spinosus Spur-winged Plover Spornkiebitz • Ixobrychus m. minutus Little Bittern Zwergdommel • Marmaronetta angustrostris Marbled Teal Marmelente • Milvus migrans Black Kite Schwarzmilan • Nycticorax nycticorax Night Heron Nachtreiher • Oxyura leucocephala White-headed Duck Weißkopf-Ruderente • Pandion haliaetus Osprey Fischadler • Pelecanus crispus Dalmatian Pelican Krauskopfpelikan • Pelecanus onocrotalus White Pelican Rosapelikan • Phalacrocorax pygmaeus Pygmy Cormorant Zwergscharbe • Philomachus pugnax Ruff Kampfläufer • Platalea leucorodia Spoonbill Löffler • Plegadis falcinellus Glossy Ibis Braunsichler • Porphyrio porphyrio Purple Gallinule Purpurhuhn • Porzana parva parva Little Crake Kleines Sumpfhuhn • Porzana porzana Spotted Crake Tüpfelsumpfhuhn • Porzana pusilla Baillon´s Crake Zwergsumpfhuhn • Sterna albifrons Little Tern Zwergseeschwalbe • Tadorna ferruginea Ruddy Shelduck Rostgans • Tringa glareola Wood Sandpiper Bruchwasserläufer 24 20 26 27 30 6 7 31 28 8 29 35 9 33 • Castor fiber Eurasian Beaver Europäischer Biber • Galemys pyrenaicus Pyrenean Desman Pyrenäen-Desman • Lutra lutra European Otter Fischotter • Microtus cabrerae Cabrera's Vole Cabreramaus • Microtus oec. arenicola Dutch Root Vole Niederländische Wühlmaus • Microtus oec. mehelyi Pannonian Root Vole Ungarische Wühlmaus • Mustela lutreola European Mink Europäischer Nerz • Myotis capaccinii Long-fingered Bat Langfußfledermaus • Myotis dasycneme Pond Bat Teichfledermaus 32 34 36 41 38 37 Reptiles 39 40 Amphibians 13 4 1 6 1 5 3 2 3 14 15 • Alytes muletensis Mallorcan Midwife Toad Balearen-Geburtshelferkröte • Bombina bombina Fire-Bellied Toad Rotbauchunke • Bombina variegata Yellow-Bellied Toad Gelbbauchunke • Chioglossa lusitanica Golden-striped Salamander Goldstreifensalamander • Discoglossus galganoi Iberian Painted Frog Iberian painted frog • Discoglossus montalentii Corsican Painted Frog Korsischer Scheibenzüngler • Discoglossus sardus Tyrrhenian Painted Frog Sardischer Scheibenzüngler • Pelobates f. insubricus Common Spadefoot Italienische Knoblauchkröte • Rana latastei Italian Agile Frog Italienischer Springfrosch • Salamandrina terdigitata Spectacled Salamander Brillensalamander • Triturus carnifex Italian Crested Newt Alpen-Kammolch • Triturus cristatus Great Crested Newt Kammolch • Triturus dobrogicus Danube Crested Newt Donau-Kammolch • Triturus karelini Southern Crested Newt Balkankammmolch • Triturus montandoni Carpathian Newt Karpatenmolch 4 12 9 11 8 2 • Elaphe quatuorlineata Four-lined Snake Vierstreifennatter • Emys orbicularis European Pond Tortoise Europäische Sumpfschildkröte • Mauremys caspica Stripe Necked Terrapin Kaspische Wasserschildkröte • Mauremys leprosa Spanish Terrapin Spanische Wasserschildkröte 10 7
2016 cells 25 countries 6 biogeo-regions Biodiversity - Spatial Resolution
Mixed Integer Programming population threshold 0 area
Systematic Conservation 10 representations of each species (nSpecies=72) 151 cells selected (nCells=2016)
60 50 Mires (Peat lands) All Wetland Wet Forest 40 Wet Grass Water Course 30 Water Bodies Area in million hectares 20 10 0 5 10 15 20 25 30 35 40 Representation Minimum
16000 Area Minimization (Endogenous Land Prices) Area Minimization (Exogenous Land Prices) Cost Minimization (Endogenous Land Prices) Cost Minimization (Exogenous Land Prices) 14000 12000 10000 Million Euro per year 8000 6000 4000 2000 0 0 5 10 15 20 25 30 35 40 45 50 Representation Minimum
Regional Location of Wetlands constant land costs increasing land costs land area Scandinavia Central Europe Western Europe Eastern Europe Southern Europe
Curses of Dimensionality Soil Carbon Dynamics
45 40 35 Wheat-Lucerne 3/3 30 Wheat-Lucerne 6/3 25 20 No-till wheat-fallow 15 Tilled wheat-fallow 10 5 0 10 20 30 40 50 Time (years) Soil Organic Carbon (tC/ha/20cm)
Curse of Dimensionality? • 20 species • 5 management options per species • 10 regions • 5 soil types per region 5,000 land use alternatives
Curse of Dimensionality? • 20 species • 5 management options per species • 10 regions • 5 soil types per region • 20 periods 5*E41 Trajectories
Soil Carbon Transition Probabilities No-till wheat-Fallow
Markov Process Indexes: t = time, u = management, o,ố = soil carbon state
45 40 Wheat-Lucerne 3/3 35 30 Wheat-Lucerne 6/3 25 20 No-till wheat-fallow 15 10 Tilled wheat-fallow 5 0 10 20 30 40 50 Time (years) Soil Organic Carbon (tC/ha/20cm)
45 40 35 Wheat-Lucerne 3/3 30 Wheat-Lucerne 6/3 25 20 No-till wheat-fallow 15 Tilled wheat-fallow 10 5 0 10 20 30 40 50 Time (years) Soil Organic Carbon (tC/ha/20cm)
Extensions? • Markov chains are applicable to relatively independent environmental qualities (tree density, humus, salt, contamination) • Method not suitable for complex environmental properties (climate)
Conclusions • Today’s solution – tomorrow’s problem? • EUFASOM aims at integrated assessments of food, climate, biodiversity, and water issues from land use • Computing power and model integration offer new opportunities – what about validation?
References • Schneider, U.A. “Soil organic carbon changes in dynamic land use decision models” Agriculture, Ecosystems and Environment 119 (2007) 359–367 • Cowie, A., U.A. Schneider and L. Montanarella (2007). Potential synergies between existing multilateral environmental agreements in the implementation of Land Use, Land Use Change and Forestry activities. Environmental Science & Policy 10(4):335-352 • Schneider U.A., J. Balkovic, S. De Cara, O. Franklin, S. Fritz, P. Havlik, I. Huck, K. Jantke, A.M.I. Kallio, F. Kraxner, A. Moiseyev, M. Obersteiner, C.I. Ramos, C. Schleupner, E. Schmid, D. Schwab, R. Skalsky (2008), “The European Forest and Agricultural Sector Optimization Model – EUFASOM”, FNU-156, Hamburg University and Centre for Marine and Atmospheric Science, Hamburg. • Schleupner, C. Estimation of Spatial Wetland Distribution Potentials in Europe. FNU-135. 2007. Hamburg, Hamburg University and Centre for Marine and Atmospheric Science. www.fnu.zmaw.de