Addressing MTBE Contamination in Hampton Bays: Modeling and Remedial Approaches
This document examines the challenge of MTBE and TAME contamination in Hampton Bays, where UST releases have impacted shallow saline surface water. Using advanced modeling techniques, we analyze MTBE concentrations across plume transects and provide predictions for air stripping tower sizing. The approach emphasizes the need for multi-level sampling and recognizes the limitations of existing models in capturing site-specific details. We also explore potential well locations and the implications of predicted mass-flux concentrations for effective remediation strategies.

Addressing MTBE Contamination in Hampton Bays: Modeling and Remedial Approaches
E N D
Presentation Transcript
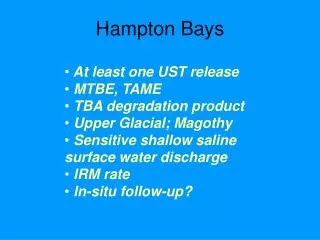
Hampton Bays • At least one UST release • MTBE, TAME • TBA degradation product • Upper Glacial; Magothy • Sensitive shallow saline surface water discharge • IRM rate • In-situ follow-up?
Critical Prediction • Maximum MTBE concentration at Interim Remedial Measure well for number and sizing of Air Stripping Towers – • Limited space • Neighborhood • - Location pre-determined
Hampton Bays Source Contamination first identified Shallow bay
Characterization • Multi-level transects across plume • Typically 8 to 12 nested sampling/wl points • Oxygenates, BTEX, EAs • No full single sampling event yet • Typical representative sample: Volume: 100,000 c-ft (x porosity)* • Area: 300 sq-ft (x porosity) • Spacing: 40 ft * Long Island ‘Rule of Thumb: 50,000 to 100,000 c-ft
Model Domain Source Source Contamination Shallow bay – constant head
IRM Recovery Well Highest Concentration along IRM ~ 10,000 ug/L
IRM - Recovery • Predicted from mass-flux: • ~ 2,500 ug/L • Predicted from model: • ~ 2,500 ug/L • Actual: • ~ 6,300 ug/L • Dilution only 1.5:1? • OR • Extra Mass?
New Well(s) Concentration 21,000
Current Work • Examine maximum-concentrations that could exist in the plume centerline, consistent with measured data • Postulate XYZ locations of several points in plume centerline • Estimate values at points • Krig points onto existing starting concentrations until best match
Salient Point Even at some of the most well characterized sites, there is detail that is not captured. A model calibrated to the data will always miss these details – but the possibilities can be investigated.