Download
1 / 25
250 likes | 370 Vues
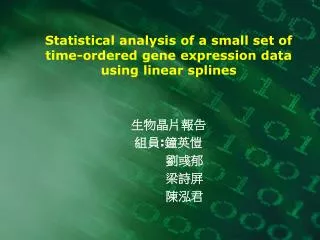
Statistical analysis of a small set of time-ordered gene expression data using linear splines. 生物晶片報告 組員 : 鐘英愷 劉彧郁 梁詩屏 陳泓君. Motivation. Recently, the temporal response of genes to changes in their environment has been investigated using cDNA microarray technology by measuring the

E N D
Statistical analysis of a small set of time-ordered gene expression data using linear splines 生物晶片報告 組員:鐘英愷 劉彧郁 梁詩屏 陳泓君
Motivation • Recently, the temporal response of genes to changes in their environment has been investigated using cDNA microarray technology by measuring the gene expression levels at a small number of time points. • Conventional techniques for time series analysis are not suitable for such a short series of time-ordered data. Ex: Fourier analysis, autoregressive…. • The analysis of gene expression data has therefore usually been limited to a fold-change analysis, instead of a systematic statistical approach.
Methods • Use the maximum likelihood method and Akaike’s Information Criterion (AIC) ->to fit linear splines to a small set of time-ordered gene expression data in order to infer statistically meaningful information from the measurements. • The significance of measured gene expression data is assessed using Student’s t-test.
Results • Previous gene expression measurements of the cyanobacterium Synechocystis sp. PCC6803 were reanalyzed using linear splines. • The temporal response was identified of many genes that had been missed by a fold-change analysis. • Based on our statistical analysis, we found that about four gene expression measurements or more are needed at each time point.
Student’s t-test • Gene expression data are usually given in terms of the base-2 logarithm of the expression ratio. • We would first like to assess if these log-ratios are significantly different from zero. • We define H0(i)as the hypothesis that for a given gene the log-ratio is equal to zero at a given time point t i, and H0 as the hypothesis that for a given gene the log-ratios at all time points are equal to zero.
Student’s t-test If we denote α as the significance level for rejection of hypothesis H0, and α as the significance level for rejection of hypothesis H0(i ) , then α and α’ are related via • α is the number of time points at which the gene expression ratio was measured. • α’ , this equation reduces to Bonferroni’s method for adjusting significance levels • H0 is not rejected, the gene is not significantly affected by the experimental manipulations • H0 is rejected, the gene was significantly affected by the experimental manipulations.
Analyzing time-ordered data using linear splines • we analyze the temporal gene expression response for genes that were found to be significantly affected. • A linear spline function is a continuous function consisting of piecewise linear functions, which are connected to each other at knots.
Piecewise linear function A function (blue) and a piecewise linear approximation to it (red).
linear spline function Fig. 1. A conceptual example of a linear spline function fitted to measured data.
linear spline function • Consider a set of data points t j , ∈ j , j ∈ {1, . . . , n}, in which t j is the time of measurement and x j is the log-ratio of the measured gene expression level. We wish to fit a nonparametric regression model of the form to these data, in which g is a linear spline function with knots (t∗0 , t∗1 , . . ., t∗q) and ∈ j , j ∈ {1, . . . , n}, are independent random variables with a normal distribution with zero mean and variance σ2. • In experiments, the logratio of the gene expression level is typically observed to follow a normal distribution.
maximum likelihood method 假設 sample 是 normal distribution, We estimate the linear spline function g using the maximum likelihood method. Given tj, Xj ‘s distribution 為了方便計算,取log,極值不變 log-likelihood function for the n data points 要求minimum σ2 The maximum likelihood estimate of the variance σ2 can be found by maximizing the log-likelihood function with respect to σ2. The log-likelihood function can then be written in the form
maximum likelihood method • The maximum likelihood estimate ˆg of the linear spline function g can now be found by minimizing ˆσ2. It can be shown that the minimum value of ˆσ2 will be achieved if the linear spline function is chosen such that • in which ˆg = (ˆg0, ˆg1, . . . , ˆgq )Tis a vector containing the estimated values ˆgiof the linear spline function at the knots ti*, A is a tridiagonal symmetric matrix given by
maximum likelihood method A00 0 … ^g0 b0’ b0’ ≡ b0 − A00 g0. For time-ordered gene expression levels given as log-ratios, we will have a fixed point g0 = 0 and therefore b0’ = b0.
Akaike’s Information Criterion AIC • The maximum number of knots qmax is equal to the number of time points at which the gene expression levels were measured. • The number of possible knot placements increases exponentially with the maximum number of knots as 1 + 2qmax−1.
Akaike’s Information Criterion (AIC) The fitted model depends on the number of knots, which can be chosen using AIC. In which the estimated parameters are ˆσ2 and ( ˆg1, ˆg2, . . .,ˆgq). q+1 The number of possible knot placements increases exponentially with the maximum number of knots as 選最小的AIC的q
Result • We will illustrate the usage of Student’s t-test and linear spline functions by reanalyzing the measured gene expression profile of the cyanobacterium sp. PCC 6803 after a sudden exposure to high light (HL) • The expression levels of 3079 ORFs were measured at 15 minutes, 1 hour, 6 hours, and 15 hours both for cyanobacteria exposed to HL and cyanobacteria that remained in the low light (LL) condition.
Student’s t-test • the background signal intensities were subtracted from the HL and LL raw data. Consistent with the original fold-change analysis, in order to reduce the effects of noise, genes with the 2000 lowest expression levels in either the LL or the HL condition were removed from the data set. The measured expression levels of these genes, being comparable to the background fluorescence levels, were dominated by noise.(去掉表現不佳的data,減少noise) • Global normalization was applied to the expression levels of the 912 remaining genes and the ratio of the HL to the LL signal intensities was calculated to find the gene expression ratio with respect to the control (LL) condition.
Student’s t-test The measured expression levels of these genes, being comparable to the background fluorescence levels, were dominated by noise At a significance level of α = 0.005, 171 genes were found to be significantly affected by the HL condition. Note that we would expect about five type-I errors among these 171 genes.
Analysis using linear spline function To assess the biological significance of our method, we applied k-means clustering to the linear spline functions fitted to the measured log-ratios for the 90 genes considered to be significantly affected.
Analysis using linear spline function Figure 4 shows the log-ratio of the gene expression level as a function of time for each cluster. The error bars shown at each time point are equal to the standard deviation over all genes in one cluster. The number of clusters was chosen to be six, which was the largest number of clusters without a significant overlap between the clusters.
Even if only two data points are removed both at the • 15 minutes and the 1 hour time point, and four data points are used at each time point, in 29% of the cases the estimated knot positions change. • This suggests that in this experiment, four or more data points are needed at each time point to reliably deduce information from the gene expression measurements.
Reference • M.J.L. de Hoon ∗, S. Imoto and S. Miyano(2002)Statistical analysis of a small set of time-ordered gene expression data using linear splines. Bioinformatics. Vol.18 no.11 2002 page 1477-1485. • http://en.wikipedia.org/wiki/Spline_interpolation • http://www.cs.mcgill.ca/~dtitle/cs350/notes/20_linsplin.pdf • http://www.cims.nyu.edu/~tornberg/Spline_construct.pdf
~The End~ Thanks for your attention.