Understanding Student Engagement: Insights from the 2013 National Survey of Student Engagement
280 likes | 416 Vues
This report presents findings from the 2013 National Survey of Student Engagement (NSSE) at ISU, exploring how students engage academically both in and outside the classroom. It highlights the time and effort students dedicate to their education, examines faculty-student interactions, collaborative learning, and the effectiveness of supportive environments. The survey includes responses from 794 students, providing valuable insights into areas of excellence and opportunities for improvement in higher education. This information serves as a crucial resource for teaching and learning discussions.

Understanding Student Engagement: Insights from the 2013 National Survey of Student Engagement
E N D
Presentation Transcript
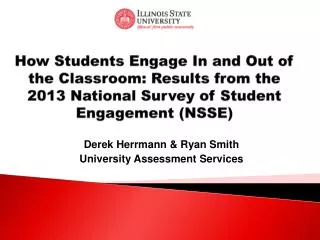
How Students Engage In and Out of the Classroom: Results from the 2013 National Survey of Student Engagement (NSSE) Derek Herrmann & Ryan Smith University Assessment Services
Dimensions of Learning & Assessment Direct Indirect
Background • What is student engagement? • Amount of time and effort students put into their academics and other educational activities • How institutions use resources and organizes curriculum and other learning opportunities • How can information on student engagement be used? • Identify areas of excellence • Identify opportunities for improvement • Used in discussions related to teaching and learning From the National Survey of Student Engagement (NSSE) website, http://nsse.iub.edu/
Background • National Survey of Student Engagement (NSSE) • Collects information about first-year and senior students’ participation in programs and activities related to learning and personal development • Items represent best practices in undergraduate education • Compliments the Beginning College Survey of Student Engagement (BCSSE) and the Faculty Survey of Student Engagement (FSSE) From the National Survey of Student Engagement (NSSE) website, http://nsse.iub.edu/
Background • National Survey of Student Engagement (NSSE) • 2013 Administration at ISU • During spring semester • 6,897 students were eligible to participate, and 794 responded (11.5% response rate) • 228 first-year students (28.7% of those who responded) • 566 senior students (71.3% of those who responded)
NSSE Themes and Engagement Indicators Range: 0 - 60
NSSE Engagement Indicators and Items • Quantitative Reasoning • Three items rated on a four-point scale (higher score indicated more often) • Used numerical information to examine a real-world problem or issue • First-year students: M = 2.2; SD = 0.9 • Senior students: M = 2.4, SD = 1.0 • Reached conclusions based on own analysis of numerical information • First-year students: M = 2.5, SD = 0.9 • Senior students: M = 2.5, SD = 1.0
NSSE Engagement Indicators and Items • Student-Faculty Interaction • Four items rated on a four-point scale (higher score indicated more often) • Worked with a faculty member on activities other than coursework • First-year students: M = 1.7, SD = 0.9 • Senior students: M = 2.3, SD = 1.1 • Talked about career plans with a faculty member • First-year students: M = 2.4, SD = 0.9 • Senior students: M = 2.8, SD = 0.9
NSSE Engagement Indicators and Items • Collaborative Learning • Four items rated on a four-point scale (higher score indicated more often) • Worked with other students on course projects or assignments • First-year students: M = 2.6, SD = 0.8 • Senior students: M = 3.1, SD = 0.8 • Asked another student to help them understand course material • Senior students: M = 2.6, SD = 0.8 • First-year students: M = 2.7, SD = 0.8
NSSE Engagement Indicators and Items • Supportive Environment • Eight items rated on a four-point scale (higher score indicated a greater emphasis) • Helping manage non-academic responsibilities • First-year students: M = 2.5, SD = 1.0 • Senior students: M = 2.4, SD = 1.0 • Using learning support services – first-year students: M = 3.3, SD = 0.8 • Providing support for overall well-being – senior students: M = 3.3, SD = 0.8
NSSE Engagement Indicators and Items • Reflective and Integrative Learning • Seven items rated on a four-point scale (higher score indicated more often) • Included diverse perspectives in course discussions or assignments • First-year students: M = 2.5, SD = 0.9 • Senior students: M = 2.8, SD = 0.9 • Connected ideas from courses to prior experiences and knowledge • First-year students: M = 3.1, SD = 0.8 • Senior students: M = 3.4, SD = 0.7
NSSE Engagement Indicators and Items • Learning Strategies • Three items rated on a four-point scale (higher score indicated more often) • Reviewed notes after class • First-year students: M = 2.8, SD = 0.9 • Senior students: M = 2.9, SD = 0.9 • Identified key information from reading assignments • First-year students: M = 3.0, SD = 0.8 • Senior students: M = 3.3, SD = 0.8
NSSE Engagement Indicators and Items • Discussions with Diverse Others • Four items rated on a four-point scale (higher score indicated more often) • People with different religious beliefs – first-year students: M = 2.9, SD = 0.9 • People from a different race or ethnicity – senior students: M = 3.0, SD = 0.9 • People from a different economic background • First-year students: M = 3.1, SD = 0.8 • Senior students: M = 3.1, SD = 0.9
NSSE Engagement Indicators and Items • Higher-Order Learning • Four items rated on a four-point scale (higher score indicated a greater emphasis) • Forming a new idea or understanding from various pieces of information – first-year students: M = 2.9, SD = 0.8 • Evaluating a point of view, decision, or information source – senior students: M = 3.0, SD = 0.8 • Applying facts, theories, or methods to practical problems or new situations • First-year students: M = 3.1, SD = 0.8 • Senior students: M = 3.2, SD = 0.8
NSSE Engagement Indicators and Items • Effective Teaching Practices • Five items rated on a four-point scale (higher score indicated a greater extent) • Provided prompt and detailed feedback on tests or completed assignments – first-year students: M = 2.7, SD = 0.8 • Provided feedback on a draft or work in progress – senior students: M = 2.9, SD = 1.0 • Clearly explained course goals and requirements • First-year students: M = 3.2, SD = 0.8 • Senior students: M = 3.3, SD = 0.7
NSSE Engagement Indicators and Items • Quality of Interactions • Five items rated on a seven-point scale (higher score indicated more positive) • Administrative staff and offices (other than academic advisors and student services staff) • First-year students: M = 4.5, SD = 1.8 • Senior students: M = 5.1, SD = 1.5 • Other students • First-year students: M = 5.6, SD = 1.2 • Senior students: M = 5.8, SD = 1.2
Reading & Writing Avg. Pages of Assigned Writing Avg. Hours per Week on Course Reading
Discussion • Conclusions • NSSE Engagement Indicators • Lowest mean scores: Quantitative Reasoning and Student-Faculty Interaction • Highest mean scores: Effective Teaching Practices and Quality of Interactions
Discussion • Conclusions • Strengths • Applying course material • Making connections between course material and prior experiences and knowledge • Identifying important information from readings • Discussing future plans with faculty • Explaining course goals and requirements • Encouraging interactions with students from different backgrounds • Using learning support/tutoring services • Providing support for overall well-being
Discussion • Conclusions • Areas for improvement • Including diverse perspectives in coursework • Reviewing notes after class • Working with faculty beyond coursework • Encouraging interactions with students from different backgrounds
Discussion • Implications • Continue to build on strengths • Further encourage • Integrating diverse perspectives • Reviewing and studying material after learning it • Participating in activities outside of the classroom • Interacting with students from different backgrounds
Discussion • Limitations • Sample size and representativeness • Mean differences (highest and lowest, first-year students and senior students) • Future directions • Continue to disseminate information • Look at student engagement longitudinally with the BCSSE • Administering the FSSE this spring
Questions? • Comments? • Concerns?
Want more information? • Mr. Derek Herrmann, UAS Coordinator • djherrm@IllinoisState.edu • 309.438.7325 • Dr. Ryan Smith, UAS Director • rlsmith@IllinoisState.edu • 309.438.2135 • http://Assessment.IllinoisState.edu/