Engineering Economy: Analyzing Plant Construction Decisions with Flexibility and Uncertainty
280 likes | 401 Vues
This session from the ESD.70J Engineering Economy course explores decision-making in plant construction, specifically weighing the benefits of building larger versus smaller plants. It discusses the importance of flexibility in decision-making and how future uncertainties can affect investment strategies. Key topics include breakeven analysis, modeling contingency decisions, and Value at Risk (VAR) analysis. Participants will gain insights into dynamic modeling techniques using Excel to account for changing demand realities, and learn how to assess the impact of delay in decisions regarding plant construction.

Engineering Economy: Analyzing Plant Construction Decisions with Flexibility and Uncertainty
E N D
Presentation Transcript
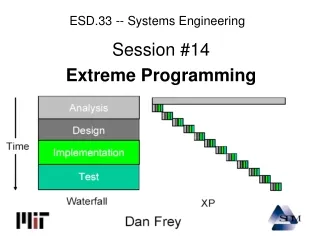
ESD.70J Engineering Economy Fall 2006 Session Four Alex Fadeev - afadeev@mit.edu Link for this PPT: http://ardent.mit.edu/real_options/ROcse_Excel_latest/ExcelSession4.pdf ESD.70J Engineering Economy Module - Session 4
Questions for “Big vs. small” The past three sessions have covered ways to model uncertainty. It seems like the big plant is better… Does it feel right? Note: we had assumed a commitment to building one small plant each year regardless of what demand reality turns out to be down the road. So much for flexibility and common sense. Lets correct that oversight! ESD.70J Engineering Economy Module - Session 4
Outline • Building flexibility into the model • VAR chart • Breakeven analysis - Goal Seek • Excel self-study references ESD.70J Engineering Economy Module - Session 4
Decide whether to build a plant Decide whether to build a plant Decide whether to build a plant Key limitation of NPV analysis • It assumes that future decisions are made today, for example for constructing small plants Year 1 Year 2 Year 3 Decide whether to build a plant • But the decisions are actually made each year Year 1 Year 2 Year 3 ESD.70J Engineering Economy Module - Session 4
Key limitation of NPV analysis • There is a LOT of value in delaying decisions until: • More information becomes available • Forecast uncertainty decreases with time and collection of additional data • Ability to delay decisions into the future is flexibility • Flexibility is the magic bullet against uncertainty ESD.70J Engineering Economy Module - Session 4
Modeling contingency decisions • Recall the spreadsheet we built for Session Two • Press “F9” and check which plan is better? • Think about the following decision rule: • After the first plant is built in year 1, we build an additional small plant only if we observe a bigger demand than capacity • How do we model that? ESD.70J Engineering Economy Module - Session 4
Modeling contingency decisions • In “Plan B” sheet: • in Cell G3 type: “=IF(E5>E4,E3+1,E3)” • In Cell I3 type: “=IF(G5>G4,G3+1,G3)” • Press “F9” • Now which plan is better now? • How easily can the traditional analysis be misleading, despite properly simulating the uncertainties! ESD.70J Engineering Economy Module - Session 4
Check the solution sheet.Please ask questions now… ESD.70J Engineering Economy Module - Session 4
Logical Functions in Excel • IF(logical_test,value_if_true,value_if_false): Returns one value if the test evaluates to TRUE and another value if it evaluates to FALSE. • MAX(number1,number2,...): Returns the largest value in a set of values. • When maximizing among the alternatives • MIN(number1,number2, ...): Returns the smallest number in a set of values. • ... ESD.70J Engineering Economy Module - Session 4
Value at Risk (VAR) Chart • Value at Risk (VAR): • A loss that will not be exceeded at some specified confidence level. • The VAR chart is aimed at making a representation of • “We are X percent certain that we will not lose more than Y dollars for this project.” • VAR is a common language on Wall Street, It stresses downside risk, though we should also look at CDF for upside potential of a project ESD.70J Engineering Economy Module - Session 4
Building VAR Chart • Add a new sheet to our latest file, and name it “VAR” • Type “NPVA” in Cell A1, “Rank” in Cell B1, “NPVB” in Cell E1, “Rank” in Cell F1 • Type “=Simulation!B8” in cell A2, drag down to A2001; Type” =Simulation!D8” in cell E2, drag down to E2001 • Type “=RANK(A2,$A$2:$A$2001,1)” in cell B2, and drag down to B2001; Type “=RANK(E2,$E$2:$E$2001,1)” in cell F2, and drag down to F2001 ESD.70J Engineering Economy Module - Session 4
Type “98%” in cell J1 and link J2 to J1 • In cell C2 type “=IF(B2=(1-$J$1)*2000,A2,0)”, and drag down to C2001; • In cell G2 type “=IF(F2=(1-$J$2)*2000,E2,0)”, and drag down to G2001 • In cell D2 type “=IF(C2=0,0,1)”, and drag down to D2001 • In cell H2 type “=IF(G2=0,0,1)”, and drag down to H2001 • Type “VAR for NPVA is” in cell K1; type “VAR for NPVB is” in cell K2 • In cell L1 type “=SUM(C2:C2001)/SUM(D2:D2001)” • In cell L2 type “=SUM(G2:G2001)/SUM(H2:H2001)” • Copy the CDF chart from the “Simulation” sheet to “VAR” sheet ESD.70J Engineering Economy Module - Session 4
Type “=L1” in K5, type “=L1” in L5, type “1” in K6, and type “0” in L6 • Type “=L2” in K8, type “=L2” in L8, type “1” in K9, and type “0” in L9 • Type "=TEXT(J1,"?%")&" VAR for NPVA"" in M5, type "=TEXT(J2,"?%")&" VAR for NPVB"" in M8 • Right click the CDF chart, click “Chart Options”, change “Chart title:” from “CDF” to “VAR” • Right click the VAR chart, click “Source Data”, click “Series”. • Click “NPVA Mean” in the left hand window, change “Name:” to “=VAR!$M$5”, change “X Values:” to “=VAR!$K$5:$L$5”, change “Y Values:” to “=VAR!$K$6:$L$6”, • Click “NPVB Mean” in the left hand window, change “Name:” to “=VAR!$M$8”, change “X Values:” to “=VAR!$K$8:$L$8”, change “Y Values:” to “=VAR!$K$9:$L$9”, • Click <OK> ESD.70J Engineering Economy Module - Session 4
Explanation • RANK(number,ref,order): Returns the rank of a number in a list of numbers. • Columns C & G pick out N-th simulation value corresponding to the desired confidence interval. • Column D and H resolve ties and would support calculation of C-VAR • Right now we only look at what happens at xx-%, but that event may not be representative • Frequently want to know “how bad do things get below xx-%”. ESD.70J Engineering Economy Module - Session 4
Try different confidence intervals by changing values in J1 and J2… • Compare 98% VAR value for • Plan A • Plan B without flexibility • Plan B with flexibility • Add C-VAR calculation ESD.70J Engineering Economy Module - Session 4
Check the solution sheet.Please ask questions now… ESD.70J Engineering Economy Module - Session 4
Question for “Big vs. small” Since Plan B with flexibility is better than Plan A, the manager is tempted to go with small plant. Just then the Chief Operations Officer reports the variable cost for the big plant can be further cut (the variable cost for a small plant remains the same). What is the break-even variable cost point for Plan A where the two plans are equivalent? ESD.70J Engineering Economy Module - Session 4
Breakeven analysis • A breakeven level for a parameter – a target value where some particularly interesting event occurs • In a deterministic case, a breakeven point can be determined by “Goal Seek” • In a simulation, we can not use DataTables (sim on sim). However, we still can do trial-and-error search ESD.70J Engineering Economy Module - Session 4
Spinner • In “Entries” enter “=Simulation!D1-Simulation!D4” next to “Simulated Avg NPVA – NPVB” in cells G3 and H3 • Choose <View> <Toolbar> <Forms> • Click button and draw a Spinner from E18 to E19 • Spinner works with integers, so modify Plan-A variable cost in cell C18 to equal = C17/100. Set C18 to 128 • Right click the spinner and click “Format Control” • Change “Current value:” to “128”, put “C17” in “Cell link:” ESD.70J Engineering Economy Module - Session 4
Spinner • Hit F9 and see how “NPVA – NPVB” values change. • Somewhere around 1.24 the NPVA – NPVB approaches 0 • Note: what we are really trying to do is run a “simulation on simulation” to find the Plan-A’s variable cost where average NPVs for the two plans are equal. • Excel does not support recursive simulations ;-( • (try it anyway if you are curious – how would you do it?) • Spinner gives an approximate answer, but requires manual input. ESD.70J Engineering Economy Module - Session 4
Check the solution sheet.Please ask questions now… ESD.70J Engineering Economy Module - Session 4
GoalSeek Solver • In class 1 we used GoalSeek to get the exact break-even point. • Solver supports constrained optimization • Want to maximize NPV for Plan B (small plant) by varying size of constructed plant? • Assume 1:1 correlation between small plant’s cost and manufacturing capacity ($300M 300K units) • Set C23 = C15 on the “Entries” sheet. • Change demand expectations to {200, 600, 900} • Set salvage cost calculation to “=MIN(Entries!C29, MAX(C11,E11,G11))” on “Plan B” sheet. ESD.70J Engineering Economy Module - Session 4
Solver • use Solver to find optimum plant size • Go to <Tools> <Solver> • Set target sell to “H5” “equal to” MAX • Set “By changing cells” to “C15” • Constrain the cost to be positive: <Add> Fill out: {Cell Reference, Relationship, Constraint} with {“$C$15”, “=>”, “=0”} • Hit <Solve>… • … Optimal small plant size is … ESD.70J Engineering Economy Module - Session 4
Check the solution sheet.Please ask questions now… ESD.70J Engineering Economy Module - Session 4
Summary • Incorporated flexibility into the models • VAR Chart • Break-even analysis • Excel as a powerful modeling tool. It will accompany you throughout your career. • We hope this short course increased your awareness of Excel’s functionality • Uncertainty/risk management is cool and very profitable ! ESD.70J Engineering Economy Module - Session 4
Excel self-study references • MS Support center http://support.microsoft.com/?scid=ph;en-us;2512 • “Advanced Excel for Scientific Data Analysis” by Robert De Levie • “Advanced modeling in finance using Excel and VBA” by Mary Jackson, Mike Staunton • www.amazon.com ESD.70J Engineering Economy Module - Session 4
Big picture of Excel • Basics • Names • References • Formula • Functions • Charts • Statistical analysis • Optimization (Solver) • Macros • Visual Basic – now sky is the limit ! Database integration Date and time f’ns Engineering f’ns Financial f’ns Information f’ns Logical f’ns Lookup and reference f’ns Math and trigonometry f’ns Text f’ns ESD.70J Engineering Economy Module - Session 4
Using Excel Help • Ways to search • Contents • Answer wizard • Index • Online at http://support.microsoft.com • Google your questions • Explore links to related topics ESD.70J Engineering Economy Module - Session 4