Download
1 / 79
890 likes | 1.31k Vues
Well Design - PE 413 Chapter 1: Formation Pressure. General Information. Instructor: Tan Nguyen Class: T and TH 1 pm - 2:15 pm Room: MSEC 105 Office: MSEC 372 Office Hours: T and TH 2:30 pm – 4:00 pm or by appointment Phone: (575) 835-5483 E-mail: tcnguyen@nmt.edu.

E N D
Well Design - PE 413 Chapter 1: Formation Pressure
General Information Instructor: Tan Nguyen Class: T and TH 1 pm - 2:15 pm Room: MSEC 105 Office: MSEC 372 Office Hours: T and TH 2:30 pm – 4:00 pm or by appointment Phone: (575) 835-5483 E-mail: tcnguyen@nmt.edu
Required Materials Applied Drilling Engineering – Adam T. Bourgoyne – SPE Textbook Fundamental of Drilling Engineering – Miska and Mitchell – SPE Textbook Volume 12 Drilling Engineering Handbook – Volume II – Robert Mitchell Class notes PowerPoint slides
Grading Homework 20% Quizzes 25% Project 20% Final exam 35%
Formation Pressure Definition – Normal Pressure During a period of erosion and sedimentation, grains of sediment are continuously building up on top of each other, generally in a water filled environment. As the thickness of the layer of sediment increases, the grains of the sediment are packed closer together, and some of the water is expelled from the pore spaces. However, if the pore throats through the sediment are interconnecting all the way to surface the pressure of the fluid at any depth in the sediment will be same as that which would be found in a simple colom of fluid. This pressure is called NORMAL PRESSURE and only dependents on the density of the fluid in the pore space and the depth of the pressure measurement (equal to the height of the colom of liquid). it will be independent of the pore size or pore throat geometry.
Overburden Pressure The vertical pressure at any point in the earth is known as the overburden pressure or geostatic pressure. The overburden pressure at any point is a function of the mass of rock and fluid above the point of interest. In order to calculate the overburden pressure at any point, the average density of the material (rock and fluids) above the point of interest must be determined. The average density of the rock and fluid in the pore space is known as the bulk density of the rock
Formation Pressure Definition – Normal Pressure
Formation Pressure Definition – Normal Pressure The datum which is generally used during drilling operations is the drillfloor elevation but a more general datum level, used almost universally, is Mean Sea Level, MSL. When the pore throats through the sediment are interconnecting, the pressure of the fluid at any depth in the sediment will be same as that which would be found in a simple column of fluid and therefore the pore pressure gradient is a straight line. The gradient of the line is a representation of the density of the fluid. Hence the density of the fluid in the pore space is often expressed in units of psi/ft.
Formation Pressure Definition – Abnormal Pressure Pore pressures which are found to lie above or below the “normal” pore pressure gradient line are called abnormal pore pressures. These formation pressures may be either Subnormal (i.e. less than 0.465 psi/ft) or Overpressured (i.e. greater than 0.465 psi/ft). The mechanisms which generate these abnormal pore pressures can be quite complex and vary from region to region. However, the most common mechanism for generating overpressures is called Undercompaction and can be best described by the undercompaction model.
Formation Pressure Definition – Abnormal Pressure Underpressured formation
Abnormal Formation Pressure Compact Effect
Abnormal Formation Pressure Compact Effect
Causes of Abnormal Pressure Subnormal Formation Pressure (a) Formation Foreshortening During a compression process there is some bending of strata. The upper beds can bend upwards, while the lower beds can bend downwards. The intermediate beds must expand to fill the void and so create a subnormally pressured zone. This is thought to apply to some subnormal zones in Indonesia and the US. Notice that this may also cause overpressures in the top and bottom beds.
Causes of Abnormal Pressure Subnormal Formation Pressure (b) Thermal Expansion As sediments and pore fluids are buried the temperature rises. If the fluid is allowed to expand the density will decrease, and the pressure will reduce. (c) Depletion When hydrocarbons or water are produced from a competent formation in which no subsidence occurs a subnormally pressured zone may result. This will be important when drilling development wells through a reservoir which has already been producing for some time. Some pressure gradients in Texas aquifers have been as low as 0.36 psi/ft.
Causes of Abnormal Pressure Subnormal Formation Pressure (d) Potentiometric Surface: This mechanism refers to the structural relief of a formation and can result in both subnormal and overpressured zones. The potentiometric surface is defined by the eight to which confined water will rise in wells drilled into the same aquifer. The potentiometric surface can therefore be thousands of feet above or below ground level
Causes of Abnormal Pressure Overpressured Formation (a) Incomplete sediment compaction or undercompaction: is the most common mechanism causing overpressures. In the rapid burial of low permeability clays or shales there is little time for fluids to escape. The formation pressure will build up and becomes overpressured formtion. In other words, If the burial is rapid and the sand is enclosed by impermeable barriers, there is no time for this process to take place, and the trapped fluid will help to support the overburden.
Causes of Abnormal Pressure Overpressured Formation (b) Faulting Faults may redistribute sediments, and place permeable zones opposite impermeable zones, thus creating barriers to fluid movement. This may prevent water being expelled from a shale, which will cause high porosity and pressure within that shale under compaction. (c) Massive Rock Salt Deposition Deposition of salt can occur over wide areas. Since salt is impermeable to fluids, the underlying formations become overpressured. Abnormal pressures are frequently found in zones directly below a salt layer.
Causes of Abnormal Pressure Overpressured Formation (d) Phase Changes during Compaction Minerals may change phase under increasing pressure, e.g. gypsum (CaSO4.H2O) converts to anhydrite plus free water. It has been estimated that a phase change in gypsum will result in the release of water. The volume of water released is approximately 40% of the volume of the gypsum. If the water cannot escape then overpressures will be generated. Conversely, when anhydrite is hydrated at depth it will yield gypsum and result in a 40% increase in rock volume. The transformation of montmorillonite to illite also releases large amounts of water.
Causes of Abnormal Pressure Overpressured Formation (e) Repressuring from Deeper Levels This is caused by the migration of fluid from a high to a low presssure zone at shallower depth. This may be due to faulting or from a poor casing/cement job. The unexpectedly high pressure could cause a kick, since no lithology change would be apparent. High pressures can occur in shallow sands if they are charged by gas from lower formations. (f) Generation of Hydrocarbons Shales which are deposited with a large content of organic material will produce gas as the organic material degrades under compaction. If it is not allowed to escape the gas will cause overpressures to develop. The organic by-products will also form salts which will be precipitated in the pore space, thus helping to reduce porosity and create a seal.
Compact Effect Vertical overburden stress resulting from geostatic load at a sediment depth D: fo is the surface porosity, K is the porosity decline constant and Ds is the depth below the surface of the sediments.
Compact Effect In offshore areas
Compact Effect Let is the depth below the subsurface of the sediment.
Compact Effect Example 1: Determine values for surface porosity and porosity decline constant K for the U.S. gulf coast area. Use the average grain density of 2.6 g/cm3, and average pore fluid density of 1.074 g/cm3.
Compact Effect Example 2: Compute the vertical overburden stress resulting from geostatic load near the Gulf of Mexico coastline at a depth of 10,000 ft. Use the porosity relationship determined in Example 1.
Differential Density Effects This effect is encountered when a gas reservoir with a significant dip is drilled. Because of a failure to recognize this potential hazard, blowouts may occur.
Differential Density Effects Example 3: Consider the gas sand shown in Figure 1.2, which was encountered in the U.S. gulf coast area. If the water-filled portion of the sand is pressured normally and the gas/water contact occurred at a depth of 5000 ft, what mud weight would be required to drill through the top of the sand structure safely at a depth of 4000 ft? Assume the gas has an average density of 0.8 lbm/gal.
Differential Density Effects Solution: P5000ft = P4000ft + PGas1000ft P4000ft = P5000ft – PGas1000ft P4000ft = 0.465(psi/ft) x 5000 (ft) – 0.052 x 0.8 (lbm/gal) x 1000 (ft) P4000ft = 2283 psi. The mud density needed to balance this pressure while drilling
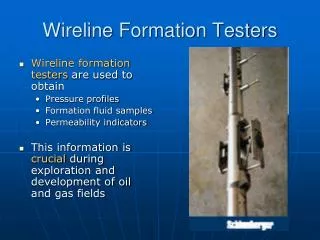
Estimation of Abnormal Formation Pressure The predictive techniques are based on measurements that can be made: Geophysical measurements: identify geological conditions which might indicate the potential for overpressures such as salt domes Analyzing data from wells that have been drilled in nearby locations (offset wells). Seismic data has been used successfully to identify transition zones Offset well histories may contain information on mud weights used, problems with stuck pipe, lost circulation or kicks. Wireline logs or mudlogging information is also valuable when attempting to predict overpressures.
Estimation of Abnormal Formation Pressure Based on Drilling Parameters The theory behind using drilling parameters to detect overpressured zones is based on the fact that: Compaction of formations increases with depth. ROP will therefore, all other things being constant, decrease with depth In the transition zone the rock will be more porous (less compacted) than that in a normally compacted formation and this will result in an increase in ROP. Also, as drilling proceeds, the differential pressure between the mud hydrostatic and formation pore pressure in the transition zone will reduce, resulting in a much greater ROP.
Estimation of Abnormal Formation Pressure Based on Drilling Parameters Torque can be useful for identifying overpressured zones. An increase in torque may occur of the decrease in overbalance results in the physical breakdown of the borehole wall and more material, than the drilled cuttings is accumulating in the annulus. There is also the suggestion that the walls of the borehole may squeeze into the open hole as a result of the reduction in differential pressure. Drag may also increase as a result of these effects, although increases in drag are more difficult to identify.
Estimation of Abnormal Formation Pressure Based on Drilling Parameters The use of the ROP to detect transition and therefore overpressured zones is a simple concept, but difficult to apply in practice. This is due to the fact that many factors affect the ROP, apart from formation pressure (e.g. rotary speed and WOB). Since these other effects cannot be held constant, they must be considered so that a direct relationship between ROP and formation pressure can be established. This is achieved by applying empirical equations to produce a “normalised” ROP, which can then be used as a detection tool.
Estimation of Abnormal Formation Pressure Based on Drilling Parameters The ROP usually changes significantly with formation type. Therefore, the ROP log is one of the important factors to predict formation pressure. The ROP is a function of many factors other than the formation type and formation pressure including: bit size, bit diameter, bit nozzle sizes, WOB, RPM, mud type, mud density, rheology of mud, pump pressure, pump rate. Therefore, it is difficult to detect formation pressure changes using only ROP
Based on Drilling Parameters Estimation of Abnormal Formation Pressure
Estimation of Abnormal Formation Pressure Based on Drilling Parameters Based on the considerable laboratory and field data, Bingham suggested an equation to calculate the ROP where W is the bit weight, db is the bit diameter, N is the rotary speed, a5 is the bit weight exponent and K is the constant of proportionality that includes the effect of rock strength
Estimation of Abnormal Formation Pressure Jorden and Shirley Model Jorden and Shirley proposed using the Bingham model to normalize penetration rate R through the calculation of a d-exponent defined by The dexp can be used to detect the transition form normal to abnormal pressure if the drilling fluid density is held constant.
Estimation of Abnormal Formation Pressure Rehm and Mcclendon Model Rehm and Mcclendon proposed modifying the dexp to correct for the effect of mud density changes as well as changes in WOB, bit diameter, and rotary speed. where rn is the mud density equivalent to a normal pore pressure gradient and re is the equivalent mud density at the bit while circulating
Estimation of Abnormal Formation Pressure Modified d-exponent data in U.S. Gulft Coast shales
Estimation of Abnormal Formation Pressure Rehm and Mcclendon Model Example 4: A penetration rate of 23 ft/hr was observed while drilling in shale at a depth of 9,515 ft using a 9.875-in bit in the U.S. gulf coast area. The WOB was 25,500 lbf and the rotary speed was 113 RPM. The equivalent circulating density at the bit was 9.5 lbm/gal. Compute the dexp and the dmod. The normal pressure gradient in the U.S. gulf coast is 0.465 psi/ft.
Estimation of Abnormal Formation Pressure Rehm and Mcclendon Model
Estimation of Abnormal Formation Pressure Rehm and Mcclendon Model The modified dexp often is used for estimating the formation pressure gradient as well as the abnormal formation pressure. Rehm and McClendon suggested the following empirical equation to calculate the equivalent mud density Formation pressure:
Estimation of Abnormal Formation Pressure Zamora Model Zamora also introduced another empirical equation to calculate the formation pressure gradient Where (gf )a and (gf)n – abnormal formation pressure gradient and normal formation pressure gradient, psi/ft The abnormal formation pressure: Pf = (gf)a x D
Estimation of Abnormal Formation Pressure Example: Given dexp vs. depth as shown in the Figure. Estimate the formation pressure at 13,000 ft using Rehm and McClendon and the Zamora correlation.
Estimation of Abnormal Formation Pressure Rehm and McClendon Method Equivalent density Formation pressure gradient Formation pressure at 13,000 ft Pf (13,000ft) = 9,464 psi
Estimation of Abnormal Formation Pressure Zamora method Pf(13,000) = 0.652 x 13,000 = 8476 psi
Detection of Formation Pressure Based on Seismic Data To estimate formation pore pressure from seismic data, the average acoustic velocity as a function of depth must be determined. A geophysicist who specializes in computer assisted analysis of seismic data usually performs this for the drilling engineer. For convenience, the reciprocal of velocity or interval transit time, generally is displayed. Interval transit time is the amount of time for a wave to travel a certain distance, proportional to the reciprocal of velocity, typically measured in microseconds per foot by an acoustic log and symbolized by t. The acoustic log displays travel time of acoustic waves versus depth in a well. The term is commonly used as a synonym for a sonic log. Some acoustic logs display velocity.
Detection of Formation Pressure Based on Seismic Data The relationship between the interval transit time t and porosity: t = tma(1 - f) + tflf where tma is the interval transit time in the rock matrix and tfl is the interval transit time in the pore fluid. Since transit times are greater for fluids than for solids, the observed transit time in rock increases with increasing porosity. With f = foe-KDs t = tma(1 - foe-KDs) + tflfoe-KDs t = tma + fo(tfl - tma)e-KDs