Comprehensive Analysis and Forecasting for Toyota's Performance and Market Positioning
120 likes | 247 Vues
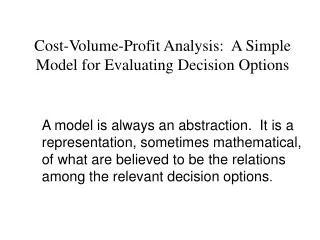
This analysis evaluates Toyota Limited's operational performance and forecasting for future growth. Founded in the 1930s in Japan, Toyota is a leading entity in the automotive industry, selling nearly 10 million vehicles globally in 2013 across diverse markets including North America, Europe, and Asia. Key metrics analyzed include the Return on Enterprise Operations, Enterprise Profit Margin (EPM), and Enterprise Asset Turnover (EATO). The report discusses revenue predictions, competitive landscape comparisons, and future sales challenges influenced by economic factors, consumer behavior, and sustainability trends.

Comprehensive Analysis and Forecasting for Toyota's Performance and Market Positioning
E N D
Presentation Transcript
Module 4: Simple Analysis and Parsimonious Forecasting Mairin Talerico
Snapshot of Toyota Limited liability, joint-stock company incorporated under Commercial Code of Japan; started in 1930s Primarily in automotive industry, but also financial services and others Sold 9.98 million vehicles in fiscal 2013 Sell in 170 different countries and regions Primary markets: Japan, North America, Europe and Asia
Return on Enterprise Operations Use average NEA for current and prior year since we do not know actual timing of investments *Note: Forecasting discussed later will use ending NEA
Breaking Apart RNEA Could be one-time items skewing comparison differences EPM indicates profit generated by each dollar of sales (profitability) EATO indicates the sales generated by each dollar of NEA (efficiency)
Breaking Apart RNEA EPM is changing significantly year to year, and EATO is relatively stable due to one-time items.
Competitors’ RNEA Break-down Toyota 2013 EPM = 5.80%, EATO = 1.36 EPM of Toyota is toward the upper spectrum of the range, and EATO of Toyota is within the range as well. GM seems to be outlier for EATO.
Parsimonious – Revenues Assume 3.68% ***Predicted industry growth = 2.4% Avg(Toyota average + prediction) = 3.68%
Parsimonious – EPM (from Sales) Assume 1.58% Toyota average = 1.58%
Parsimonious – EATO Assume 1.40 Toyota average = 1.35, heading upward so,
Parsimonious Assumptions Sales growth rate 3.68% Enterprise profit margin (EPM) 1.58% Enterprise asset turnover (EATO) 1.40
Industry Analysis • GM, Ford, and Honda were not sufficient to gather appropriate info in each category consistently on Toyota • Revenue is unique makeup for each firm of both car revenue and financing revenue • Hard to predict future of sales due to macro effects on economy • Consumer disposable income, price of gasoline, future of “green” cars and energy