Download
1 / 3
30 likes | 209 Vues
Geographic Information Science (GIS) has established mapping and spatial reasoning as essential methods for problem-solving. Geospatial professionals use GIS to develop buildings, manage disaster response, address public health concerns and much more. For all these innovations, however, traditional GIS systems can be limited by working with only two dimensions.

E N D
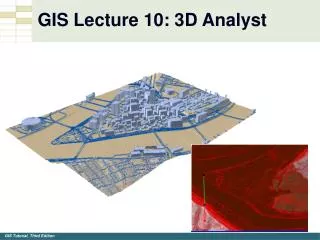
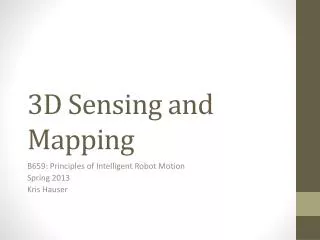
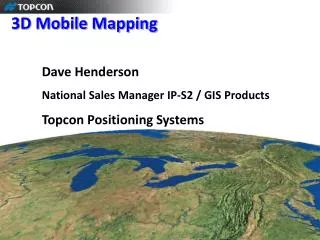
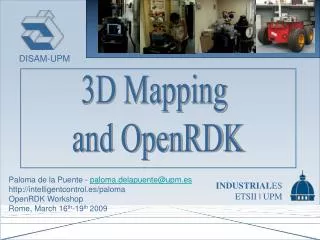
3D GIS Overview – 3D Mapping Geographic Information Science (GIS) has established mapping and spatial reasoning as essential methods for problem-solving. Geospatial professionals use GIS to develop buildings, manage disaster response, address public health concerns and much more. For all these innovations, however, traditional GIS systems can be limited by working with only two dimensions. As spatial software and techniques continue to evolve, accredited online GIS certificate has been adopted for a wide range of applications. Just as GIS delivered innovative approaches to compiling and analyzing maps, adding a third dimension opens fresh possibilities for fields ranging from urban planning to earth sciences. What is 3D GIS? Like standard maps, traditional GIS systems are plotted along two dimensions: the horizontal (x) and vertical (y) axes. 3D GIS goes beyond providing coordinates and makes it possible to depict objects in greater detail by adding another dimension (z). Most commonly, 3D mapping serves to represent elevation as well as location, creating scale models of features in the earth or buildings. For instance, a topographical map created with 3D GIS can show the height of a mountain, not just its location. However, geospatial professionals may also choose to plot other variables as z-values or even assign multiple values to the same two-dimensional coordinate. The third dimension might represent: https://gis.usc.edu/
An urban area’s population density The relative suitability of various plots of land for development Concentrations of chemicals and minerals throughout a region The positions of aircraft The depths of underground wells. All the possibilities that come with 3D GIS also mean adding complexity to the processes involved in developing mapping layers and maintaining spatial information databases. Committing the additional effort and resources is worthwhile in situations where the resulting visualizations allow detailed analysis and accurate planning. Geospatial professionals continue to experiment and discover how the practical applications of 3D GIS software can bring about more powerful problem-solving and in-depth visualizations. Applying 3D GIS in Disaster Response In some of the most hazardous situations that face individuals and communities, 3D GIS can help. Extensive geographic data and up-to-date, nuanced visualizations guide efforts to save lives and property or rebuild after devastating events. Wildfires like the record blazes that raged across California in 2018 can offer examples of how geospatial information proves crucial in planning and executing disaster response. During a fire, detailed maps provide emergency personnel with situational awareness, including information like: The coordinates of a fire and best way to reach it The types of terrain and vegetation in the area Available routes for evacuation https://gis.usc.edu/
Priorities for protecting structures Current weather conditions After firefighters extinguish the flames, 3D GIS mapping software can make the labor of restoring a decimated area more efficient and effective. In a hilly region, tasks like fertilizing and seeding the land for new plant growth may be complicated by uneven terrain and weather conditions. Wind and rain might transport fertilizer particles to low-elevation areas or outside of the target zone entirely. By implementing 3D mapping and drawing on historical weather data, planners can account for elevation in their strategies, accurately anticipating wind conditions to distribute seeds and fertilizer evenly. With this data, experts make strategic decisions about where to concentrate the new growth and safely lay out construction plans for nearby roads or walking paths. Spatial Reasoning for Clean Energy Initiatives Clean energy infrastructure is another field that has seen a growing demand for 3D GIS. Local government agencies rely on spatial planning to develop sites for renewable energy production. As alternatives to fossil fuels become integral to power industry and transportation, 3D GIS has proven invaluable for taking full advantage of these energy sources and promoting a greener future. By examining layers of relevant data, planners consider what areas would be best for producing wind, solar, geothermal or biomass and maximize the chances of success for renewable energy initiatives. For example, officials can: Decide what parcels of land have soil that is suitable to grow crops for biodiesel Situate wind farms in areas that pose minimal danger to migrating birds Employ radiation maps to evaluate whether a building is a good candidate for solar panel installation Monitor the status of construction or maintenance projects in real time and provide useful spatial information to workers Join Us: Facebook | Twitter | LinkedIn Phone: (877) 650-9054 Email: gis@usc.edu https://gis.usc.edu/