Download

1 / 36
360 likes | 729 Vues
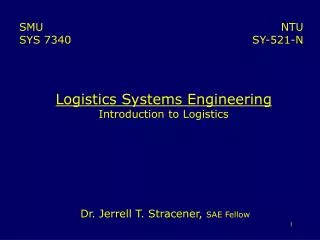
Introduction into Logistics. PhD Natasha Lutovinova Logistics Lecturer E-mail: Lutovinova.N@nhtv.nl Room: G1.006. Handbook: Paul R. Murphy & Donald F. Wood, Contemporary logistics (New Jersey 2011), 10 th edition. 3. Introduction into Logistics Course Outline. 12.05 Introduction

E N D
Introduction into Logistics PhD Natasha Lutovinova Logistics Lecturer E-mail: Lutovinova.N@nhtv.nl Room: G1.006
Handbook: Paul R. Murphy & Donald F. Wood, Contemporary logistics (New Jersey 2011), 10th edition 3
Introduction into Logistics Course Outline 12.05 Introduction 13.05 SCM Concept, Inventory 14.05 Demand Management, Warehousing Management 15.05 Transportation Management, International Logistics 16.05 Poster Session
CHAPTER 8 Inventory Management 5 - 3
Learning Objectives • To understand the costs of holding inventory • To understand reordering concepts • To differentiate the various inventory flow patterns 6 - 3
350 g € 1.32 600 g € 1.84 10 g € 0.22 15 g € 0.36
3 - 8 Delivery Procurement Manufacturing Logistics lead time 5.14 The lead-time gap Customer’s order cycle Order fullfilment Lead-time gap Logistics lead time 5.15 Closing the lead-time gap Customer’s order cycle
Inventory Management • Inventories are stocks of goods and materials that are maintained to satisfy normal demand patterns • Inventory management • Decisions drive other logistics activities • Different functional areas have different inventory objectives • Inventory costs are important to consider • Inventory turnover 9 - 3
Inventory Management • Inventory management (continued) • Inventory costs are important to consider • Inventory turnover: cost of goods sold divided by average inventory at cost cost of goods sold = inventory turnover average inventory $200,000 = inventory is sold 4 times per year $ 50,000 • Compare with competitors or benchmarked companies 10 - 3
Visser, Logistics: Principles, fig.1.8 cost structure of physical distribution 11 - 3
Reduction of the lead time Improve delivery reliability Total cost approach Increase flexibility Logistics objectives are mutually interdependent Low inventory turnover = high inventory carrying costs, little (or no) stockout costs High inventory turnover = low inventory carrying costs, high stockout costs Managing the trade-off is important to maintain service levels 12 - 1
Inventory Classifications • Cycle (or base) stock • Safety (or buffer) stock • Pipeline (or in-transit) stock • Work in process • Speculative stock • Strategic stock • Dead Stock • Psychic stock 13 - 3
Inventory-Related Costs • Inventory carrying (holding) costs • Inventory carrying (holding) costs • Obsolescence • Inventory shrinkage • Storage costs • Handling costs • Interest charges • Insurance costs • Taxes • Opportunity cost 15 - 3
Inventory-Related Costs • Stockouts • Stockout costs • Trade-offs Exist between Carrying and Stockout Costs 16 - 3
When to Order • Fixed order quantity system • Fixed order interval system • Reorder (trigger) point (ROP) ROP = DD x RC (under certainty) ROP = (DD x RC) + SS (under uncertainty) Where DD = (average) daily demand RC = length of replenishment cycle SS = safety stock 17 - 3
When to Order ROP = DD x RC (under certainty) ROP = (DD x RC) + SS (under uncertainty) DD = daily demand =30 pieces RC = replenishment cycle =2 (days) SS = safety stock =60 Reorder point = 120 pieces 18 - 3
Reorder (trigger) point Quantity Ordering R = Variable order interval Q = Fixed order quantity T = Fixed order interval S = Variable order quantity 19 - 3
How Much to Reorder • Economic order quantity (EOQ) in units EOQ = √2DB/IC Where EOQ = the most economic order size, in units D = annual demand, in units B = administrative costs per order of placing the order C = carrying costs of the inventory (%) I = dollar value of the inventory, per unit 20 - 3
How Much to Reorder • Economic order quantity (EOQ) in dollars EOQ = √2AB/C Where EOQ = the most economic order size, in dollars A = annual usage, in dollars B = administrative costs per order of placing the order C = carrying costs of the inventory (%) 21 - 3
How Much to Reorder • Economic order quantity (EOQ) in dollars EOQ = √2AB/C A = annual usage = $1000 B = administrative costs = $25 C = carrying costs = 0.2 (20%) EOQ = √2*1000*25/0.2 = $500 order size 23 - 3
How Much to Reorder? • Economic order quantity (EOQ) in dollars EOQ = √2AB/C A = annual usage B = administrative costs C = carrying costs 24 - 3
How Much to Reorder • Economic order quantity (EOQ) in units EOQ = √2DB/IC D = annual demand, in units = 200 B = administrative costs = 25 C = carrying costs = 5 I = value per unit = 0.2 (20%) • EOQ = √2*200*25/.20*5 = 100 25 - 3
How Much to Reorder? • Economic order quantity (EOQ) in units EOQ = √2DB/IC D = annual demand (in units) B = administrative costs C = carrying costs I = value per unit 165 – 178 – 183 – 192 20 – 22 – 24 – 26 90 – 95 – 100 – 105 270 – 280 – 290 – 310 300 – 322 – 336 – 344 26 - 3
Table 9-3: EOQ Cost Calculations B C 27 - 3
Inventory Flows • Safety stock can prevent against two problem areas • Increased rate of demand • Longer-than-normal replenishment • When fixed order quantity system like EOQ is used, time between orders may vary • (When reorder point is reached, fixed order quantity is ordered) 28 - 3
Figure 9-3: Inventory Flow Diagram Reorder point Average inventory in units = Q/2 (+ SS) 29 - 3
Contemporary Approaches to Managing Inventory • ABC Analysis 30 - 3
Contemporary Approaches to Managing Inventory • ABC Analysis • Just-in Time (JIT) Approach 32 - 3
Figure 9-4: Trailer that opens on the side and is used for rapid discharge of parts 33 - 3
Contemporary Approaches to Managing Inventory • ABC Analysis • Just-in Time (JIT) Approach • Vendor-Managed Inventory (VMI) • Inventory Tracking 34 - 3
Inventory Management: Special Concerns FiFo Complementary items Dead inventory Deals Defining stock-keeping units (SKUs) Informal arrangements outside the distribution channel Repair and replacement parts Reverse logistics Substitute Products 35 - 3
Next time: Assignment Obligatory: Choose a product, draw an inventory flow diagram and describe it 36 - 3