Download
1 / 42
420 likes | 513 Vues
On Scale of 0 to 500, Beijing’s Air Quality Tops ‘Crazy Bad’ at 755 (Source: NYT)*. The State of the World's Children 2012: Children In An Urban World.

E N D
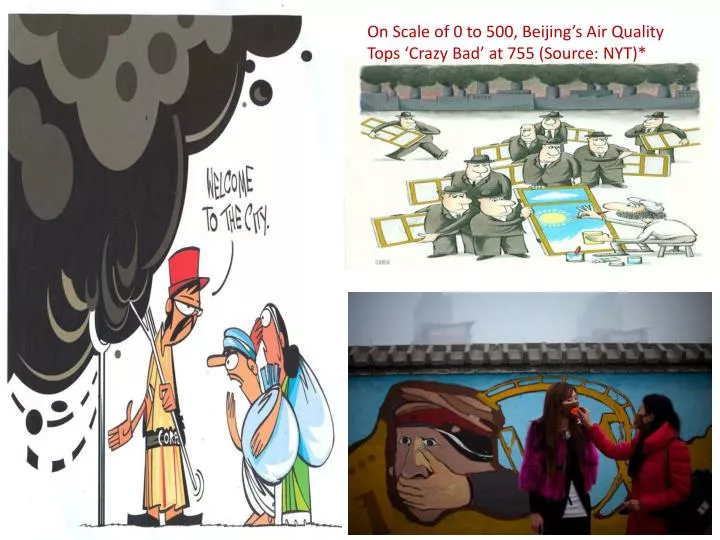
On Scale of 0 to 500, Beijing’s Air Quality Tops ‘Crazy Bad’ at 755 (Source: NYT)*
The State of the World's Children 2012: Children In An Urban World • Governments (should) put children at the heart of urban planning and finds that for millions of children urban poverty is intensified by exposure to disasters. • Nearly eight million children died in 2010 before reaching the age of five, including two million from polluted indoor air caused by inadequate ventilation in sub-standard housing. City life also exposes children to high levels of outdoor air pollution and traffic accidents. • Children are at high risk in such locations, as they seldom have access to information or protective infrastructure, that can help people withstand extreme events.
McKinsey (2010) India's Urban Awakening • 2008-2030: Assumption of 7.4 percent growth rate per annum • Recycling Old Wine: Implement 74th amendment- decentralization • Mumbai’s GDP is projected to reach $ 265 billion by 2030 • Addressing life in India’s cities is clearly not an elitist endeavor but rather a central pillar of inclusive growth
Opening a Can • A physicist, a chemist, and an economist are shipwrecked on a desert island with only a can of beans to eat and no way to open it. • The physicist makes a suggestion: "I can calculate just the right angle, mass, and velocity of a projectile that will knock the top off the can." "No!" the economist cries, "That might spill the beans.“ • The chemist then says, "I can make a compound from some local plants that will eat through the tin and open the can." "Fool! That would contaminate the beans!" says the Economist. • Exasperated, the other two ask the economist if he has a plan. "Of course!" says the economist, "The solution is simple. First, we assume we have a can opener..." The McKinsey Report makes many assumptions
Will India’s Cities be the Engine for the Growth Process? Depends on the Headwind and Tailwind S. Chandrasekhar chandra@igidr.ac.in Indira Gandhi Institute of Development Research
In the Indian Context What is Urban? • All places with a municipality, corporation, cantonment board or notified town area committee, etc are Statutory Towns • An urban agglomeration is a continuous urban spread constituting a town and its adjoining outgrowths or two or more physically contiguous towns together with or without outgrowths of such towns. An Urban Agglomeration must consist of at least a statutory town and its total population (i.e. all the constituents put together) should not be less than 20,000 as per the 2001 Census
In the Indian Context What is Urban? • An Out Growth is a viable unit such as a village or a hamlet or an enumeration block made up of such village or hamlet and clearly identifiable in terms of its boundaries and location. Some of the examples are railway colony, university campus, port area, military camps, etc., which have come up near a statutory town outside its statutory limits but within the revenue limits of a village or villages contiguous to the town. While determining the outgrowth of a town, it has been ensured that it possesses the urban features in terms of infrastructure and amenities such as pucca roads, electricity, taps, drainage system for disposal of waste water etc. educational institutions, post offices, medical facilities, banks etc. and physically contiguous with the core town of the UA.
Distribution of Population • 377 million constituting 31.16% of the total population • 264.9 million persons, constituting 70% of the total urban population, live in Class I UAs/Towns (population >100,000). • 160.7 million persons (or 42.6% of the urban population) live in the 53 million plus Urban Agglomeration / Cities • Mega Cities: Greater Mumbai UA (18.4 million), Delhi UA (16.3 million) and Kolkata UA (14.1 million) Million Plus UAs/Cities
The Indian City in History Ease of Transport (river, roads), Trade Locations, Better Access to Natural Resources, Strategic Locations (expansion & control purpose) Annapurna Shaw (2011) Indian Cities, Oxford University Press
Land Acquisition: Pfizer (New London, Conn) • Eminent Domain: The power to take private property for public use by a state, municipality, or private person or corporation authorized to exercise functions of public character, following the payment of just compensation to the owner of that property. • Supreme Court of USA ruled (5-4) in favor of City of New London - The city had created the New London Development Corporation to buy up the nine-acre neighborhood and find a developer to replace it with an “urban village” that would draw shoppers and tourists to the area. • 2009: Pfizer said it would pull 1,400 jobs out of New London within two years and move most of them a few miles away to a campus it owns in Groton, Conn. • http://www.nytimes.com/2009/11/13/nyregion/13pfizer.html?_r=0
Movement of Labor: Rural-Urban • Harris-Todaro Model of Rural Urban Migration • Model of Rural Urban Migration with Land as a Constraint • Scenario A: Only the poor move from rural to urban • Scenario B: Only the non-poor move from rural to urban • Reality lies between these two scenarios • Decomposing the reduction in rural poverty suggests that over the period 1993-2002, migration accounted for only 19 percent of the reduction in worldwide rural poverty while 81 percent of the reduction could be ascribed to improved rural livelihoods (World Bank 2007).
Mobility of Workers- Migration (%) Stream: RR-62 RU-19 UR-6 UU-13 (all) Stream: RR-28 RU-38 UR-9 UU-25 (without marriage)
Typology of Households • Farm-oriented (more than 75% of total income from farm production); farm, market-oriented (more than 50% of agricultural production sold on market); farm, subsistence (<= 50% of agricultural production sold on market); labor-oriented household (more than 75% of total income from wage or nonfarm self employment); migration/transfers-oriented household (more than 75% of total income from transfers/other non-labor sources); and diversified households.
Exclusionary Urbanization Hinders R-U Migration • India’s Vice President: “our urban spaces and governance mechanisms have become the theatres for political conflicts and economic struggles. ‘Exclusionary’ urbanization is benefitting certain social groups to the detriment of others, and directing resources to large metropolises depriving small and medium towns of funds needed for infrastructure and essential services”.
Fixing Service Delivery • Decentralization the buzz word (Indonesia Example) • Lack of Governance = Monopoly Power + Discretion – (Accountability + Low Salaries) – Lack of Institutional Structure (Markets and Non-Market Based Mechanisms) • Clearly define outcomes • Create sound regulatory, institutional and legal framework in order to promote accountability of • Service provider to the user • Policy maker to the user • Service provider to the policy maker
Flow of Investments and Climate Change • Investments are flowing to districts and cities (low elevation coastal zone) at risk of climate change induced events • Till recently no mention in industrial policy on the need to steer fresh investments away from at risk locations • But the issue is how does one enforce it since it make commercial sense to locate near the ports • The cities identified as the growth centers for the IT industry are in low elevation coastal zones or dry land areas
Globalization • Is US economic growth over? (Robert J Gordon) • IR#1 (steam, railroads) from 1750 to 1830 • IR#2 (electricity, internal combustion engine, running water, toilets, communications, entertainment, chemicals, petroleum) from 1870 to 1900 • IR#3 (computers, the web, mobile phones) from 1960 to present • What if conjecture is true? • Global trade in services has helped the skilled, educated, middle class in India (unlike in the USA) • Cross country teams (Manager – Worker combinations)
Globalization • What if Gordon’s conjecture is true? • Global trade in services has helped the skilled, educated, middle class in India (unlike in the USA) • Cross country teams (Manager – Worker combinations)
Service Sector: Rev or Sputter Sources of Growth 1980-2009 Job Creation (1991-2006) The potential for explosive growth was usually only seen in the manufacturing sector: this is no longer the case. (Ejaz Ghani et. al. (2012) Service with a Smile)
Service: Rev or Sputter Sources of Growth 1980-2009 Job Creation (1991-2006) The potential for explosive growth was usually only seen in the manufacturing sector: this is no longer the case. (Ejaz Ghani et. al. (2012) Service with a Smile)
Tailwinds > Headwinds • Agglomeration Effects, Knowledge Spill Over, Division of labour • Mass production, Increased productivity • Natural advantage, Transport costs, Job location affects the housing decisions, Workers will live in vicinity of factory emergence of towns/cities which in turn will attract other industries to support the population. • Slow infrastructure development • Lack of labour intensive manufacturing sector* • Unable to take advantage of demographic dividend: Low education and skill development • Slow social sector development: poverty, inequality and human development • Governance problems Conditions for Socio-Economic Leapfrog
Tackling the Headwinds • Learn from East Asia • Increase education (RTE, Skill) • Increase workforce participation rate (Education, Marriage) • Fix infrastructure (Governance) • Increase investment GDP ratio (Savings Rate, Physical savings)