Download
1 / 1
10 likes | 163 Vues
Current Status of the MODIS LST Product and Plans for the Future.

E N D
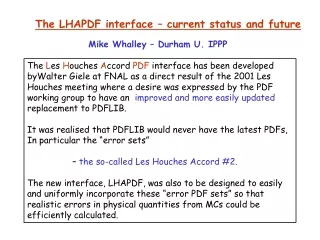
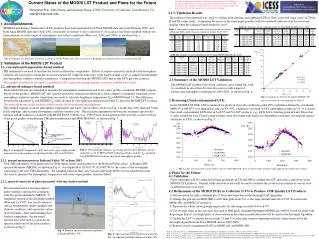
Current Status of the MODIS LST Product and Plans for the Future This work was supported by NASA’s EOS Program contract NAS5-31370. Thanks to the staffs at Airborne Sensor Facility, NASA Ames Research Center, and at the ER-2 Operations Office, NASA Dryden Flight Research Center, for providing the MAS data, and to many others for their supports in the various field campaigns. Zhengming Wan, Yulin Zhang, and Qincheng Zhang, ICESS, University of California, Santa Barbara, CA 2.2.3, Validation Results (wan@icess.ucsb.edu) The radiance-based method was used to validate both daytime and nighttime LSTs in Terra cases and Aqua cases, in Tables II and III, respectively. Comparing the errors in the same night granules with two methods indicates that the errors are smaller when the radiance-based method is used. 1. Accomplishments Table II, Radiance-based validation of the V4 Terra MODIS MOD11A1 LSTs. MODIS Land-Surface Temperature (LST) products have been generated from Terra MODIS data since late February 2000 and from Aqua MODIS data since June 2002 consistently in version 4 (also collection 4). Its accuracy has been validated with in-situ measurements in wide ranges of atmospheric and surface conditions (Wan et al., 2002 and 2004), as shown in Fig. 1. Table I, Atmospheric temperature and water vapor profiles measured in Railroad Valley under clear-sky conditions in June 26-29, 2003. Table III, Radiance-based validation of the V4 Aqua MODIS MYD11A1 LSTs. Fig. 1, Validation sites (from left): Lake Titicaca, Bolivia & Peru; Walker Lake, NV; rice field, CA; Bridgeport w/o and with snow, CA; soybean field, MS. 2. Validation of the MODIS LST Product 2.1, conventional temperature-based method TIR radiometers are used to measure the surface radiometric temperature. Effects of surface emissivity and reflected atmospheric radiation are corrected to obtain the in-situ measured LST using the emissivity value based on land-cover or sample measurements and atmospheric radiative transfer simulations. Comparisons between the MODIS LSTs and in-situ LSTs give the accuracy. 2.3 Summary of the MODIS LST Validation This method is limited by the spatial variation in LSTs, especially during daytime, as shown in MAS data clearly. The MODIS LST products have been validated, most within 1K, with two methods in more than 40 clear-sky cases in wide ranges of surface and atmospheric conditions in 2000-2003, as shown in Fig. 6. 2.2, advanced radiance-based method Radiosonde balloons are launched to measure the atmospheric temperature and water vapor profiles around the MODIS overpass. Based on the profiles, MODIS LST and spectral emissivity measured in the field or from samples or estimated from land-cover, atmospheric radiative transfer simulations are made to calculate brightness temperature Tb in MODIS band 31. The difference between the calculated Tb and MODIS Tbvalues divided by atmospheric transmission in band 31 gives the MODIS LST accuracy. Fig. 6, Comparisons between V2 and V4 MODIS LSTs and in-situ values in field campaigns in 2000-03. 3. Removing Cloud-contaminated LSTs The main advantage of this method is that it works for both daytime and nighttime. In the MODIS LST PGE, LST is retrieved for pixels in clear-sky conditions at the 99% confidence defined by cloudmask MOD35 or MYD35 over land and in lakes in V3, 99% confidence over land or 66% and higher in lakes in V4. It is found that cloud-contaminated LSTs exist in both V3 and V4 LST products, e.g., LSTs below freezing point in Lake Tahoe that is open around the year. Cloud-screen schemes were developed with landcover-dependent constraints on temporal-spatial variations in LSTs, as shown in Fig. 7. This method requires accurate atmospheric temperature and water vapor profiles, such as in Fig. 2 in the June 2003 Railroad Valley field campaign, and accurate atmospheric radiative transfer code. The excellent agreements between the measured spectral sky radiance and the radiance calculated with MODTRAN4.0 (Berk et al., 1999) based on measured profiles provide a solid evidence of the good quality of the Bomem TIR spectroradiometer and MODTRAN4.0, as shown in Fig. 3. Radiosonding 10:29 – 12:29 PDT 29 June 2003 (17:29 – 19:29 UTC 29 June 2003) at 38o29.036´N, 115o41.260´W 1.45km above sea level column water vapor = 0.84 cm Fig. 3, Downwelling radiance Tbat nadir measured by Bomem spectro-radiomter at 10:30 PDT 6/29/03 in Railroad Valley and the Tb calculated by MODTRAN4.0 based on measured atmospheric profiles. Fig. 2, Atmospheric temperature (left) and water vapor (right) profiles measured by radiosonding over Railroad Valley, NV on 6/29/2003. 2.2.1, ground measurements in Railroad Valley, NV in June 2003 Four TIR radiometers were deployed in a 500m square in the central portion of the Railroad Valley playa. A Bomem TIR spectroradiometer (MR100), as shown in Fig. 4, was deployed at 38.4817oN 115.6905oW, by the center of the rectangular consisting of the four TIR radiometers. Six sounding balloons that carry Vaisala radiosonde RS90-A were launched in clear sky days to measure the atmospheric temperature and water vapor profiles, listed in Table I. Fig. 7, LSTs near the center of Lake Tahoe in the year 2002 MOD11A1 data sets before (left) and after (right) applying the cloud-screen scheme. 4. Plans for the Future 4.1 Validation Field campaigns will be conducted in large grasslands in TX and NM to validate the LST and surface emissivity in the MODIS LST products. Ground truths and station data will be used to evaluate the cloud-screen scheme at various sites of different land-cover types. 2.2.2, spectral emissivity of playa measured with sun-shadow method We measured surface-leaving radiance under sunshine and shadow conditions with the spectroradiometer MR100. A simplified version of the day/night method (Wan and Li, 1997) was used to retrieve surface temperatures under sunshine and shadow conditions, and emissivity values in seven bands. After determining playa Surface temperature, the measured spectral data were used to calculate the spectral emissivity of the playa surface, as shown in Fig.5. 4.2 Refinements of the MOD11 PGEs in Collection 5 (V5) to Produce CDR Quality LST Products 1) Add an option for fully combined use of Terra and Aqua data in the day/night LST algorithm. 2) Change the grid size in MOD11B1 to 6x6 1km grids from 5x5 so the same latitude interval of 0.05o be used in the MOD11B1 and MOD11C products. 3) Separate the whole viewing angle region into six sub-ranges instead of five in V4. 4) Use average slope in the east-west direction at 6km grids. Azimuth-dependent MODIS data will be stored for grids with slope larger than 6o, day/night pairs of observations in the same azimuth direction will be used in the day/night algorithm. 5) Update the LUT of emissivities in bands 31 and 32 for the split-window algorithm with the values retrieved by the day/night algorithm from Terra MODIS data in 2000-2003. 6) Remove cloud-contaminated LSTs in MOD11A1 and MOD11B1. Fig. 4, Bomem spectroradiometer deployed in RailroadValley, NV. Berk, A., G.P. Anderson, et al., “MODTRAN4 radiative transfer modeling for atmospheric correction”, SPIE, vol. 3756, 348-353, 1999. Wan, Z. and Z.-L. Li, “A physics-based algorithm for retrieving land-surface emissivity and temperature from EOS/MODIS data”, IEEE Trans. Geosci. Remote Sens., vol. 35, 980-996, 1997. Wan, Z., Y. Zhang, Q. Zhang, and Z.-L. Li, “Validation of the land-surface temperature products retrieved from Terra Moderate Resolution Imaging Spectroradiometer data”, Remote Sens. Environ., vol. 83, 163-180, 2002. Wan, Z. Y. Zhang, Q. Zhang, and Z.-L. Li, “Quality assessment and validation of the MODIS global land surface temperature”, Int. J. Remote Sens., vol. 25, 261-274, 2004. Fig. 5, Spectral emissivity of playa measured by the sun-shadow method in Railroad Valley, NV.