500
3500. 3000. Idaho. Oregon. 2500. 2000. 3500. Cascade Mountains. 1500. 3000. 1000. 2500. 500. N. 2000. Intermountain West. 1500. 1000. Pacific Ocean. 500. Nevada. Utah. LT. Sierra Nevada. California. High Sierra. 4000. High Sierra. 3000. Elevation (m). LCRB. Arizona.

500
E N D
Presentation Transcript
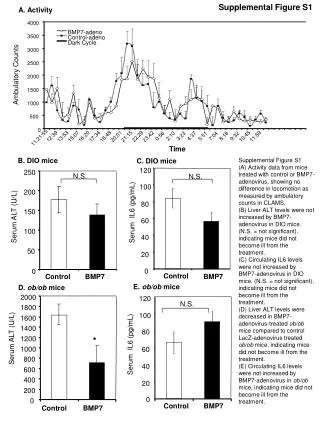
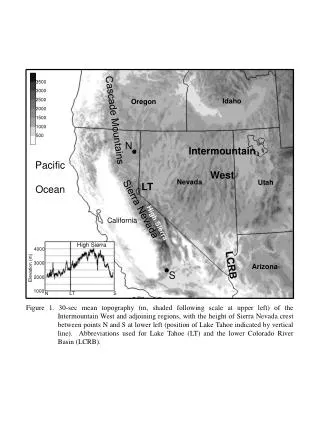
3500 3000 Idaho Oregon 2500 2000 3500 Cascade Mountains 1500 3000 1000 2500 500 N 2000 Intermountain West 1500 1000 Pacific Ocean 500 Nevada Utah LT Sierra Nevada California High Sierra 4000 High Sierra 3000 Elevation (m) LCRB Arizona 2000 S 1000 N LT S Figure 1. 30-sec mean topography (m, shaded following scale at upper left) of the Intermountain West and adjoining regions, with the height of Sierra Nevada crest between points N and S at lower left (position of Lake Tahoe indicated by vertical line). Abbreviations used for Lake Tahoe (LT) and the lower Colorado River Basin (LCRB).
0000 UTC 26 Mar 700 hPa: 1200 UTC 25 Mar SFC: 1200 UTC 25 Mar SFC: 0000 UTC 26 Mar 08 10 08 16 12 00 12 00 04 L 04 20 96 L 06 L 02 10 12 14 70 80 90 70 80 90 18 12 16 Figure 2. Synoptic structure of the 25 Mar 2006 cold front at 1200 UTC 25 Mar (left panels) and 0000 UTC 26 Mar 2006 (right panels). Manual surface analyses (top) include conventional frontal symbols, sea level contours (every 2 hPa), and surface wind observations (full and half barb denote 5 and 2.5 m s-1, respectively). NAM 700-hPa analyses (bottom) include temperature contours (every 2°C), wind (full and half barb denote 5 and 2.5 m s-1, respectively), and 800–500-mb mean relative humidity (shaded following scale at lower left). Adapted from Steenburgh et al. (2009).
a) FULLTER 3500 3000 2500 2000 1500 1000 500 b) NOSIERRA Figure 3. WRF topography [m, shaded following scale in (a)] for a subset of the (a) FULLTER and (b) NOSIERRA 12-km nested domain.
296 296 288 288 288 296 288 296 296 288 296 288 20 ms-1 10 50 0 45 50 40 -10 30 35 -20 30 10 -30 25 20 -10 -40 15 -50 -30 10 -60 5 -50 -70 a) FULLTER Cloud/Radar 1500 UTC b) NOSIERRA Cloud/Radar 1500 UTC Y Y X X d) NOSIERRA Kinematic (Fw) 1500 UTC c) FULLTER Kinematic (Fw) 1500 UTC e) FULLTER Diabatic (FD) 1500 UTC f) NOSIERRA Diabatic (FD) 1500 UTC Figure 4. WRF-model analyses for 1500 UTC 25 Mar 2006. (a) FULLTER radar reflectivity [dBZ, color shaded according to scale in (a)], cloud-top temperature (°C, grey shaded according to scale in (b)], and 850-hPa geopotentialheight (solid contours every 10 m). (b) Same as (a) but for NOSIERRA. (c) FULLTER lowest half-η level potential temperature (every 2 K), wind (vector scale at left), and kinematic frontogenesis [K (100 km h)−1, shaded following scale at left]. (d) Same as (c), but for NOSIERRA. (e) Same as (c), but with diabaticfrontogenesis. (f) As in (e) but for NOSIERRA.
288 296 304 296 288 288 288 296 296 296 304 20 ms-1 8 6 4 2 0 -2 Y Y -4 -6 b) FULLTER-NOSIERRA 1800 UTC a) FULLTER-NOSIERRA 1500 UTC Y Y A X X X X d) FULLTER-NOSIERRA 0000 UTC c) FULLTER-NOSIERRA 2100 UTC Figure 5. FULLTER lowest half-η level potential temperature (every 2 K), FULLTER-NOSIERRA lowest half-η level potential temperature difference [K, shaded according to scale in (a)], and FULLTER-NOSIERRA lowest half-η level vector wind difference [scale in (a)] at (a) 1500 UTC 25 Mar, (b) 1800 UTC 25 Mar, (c) 2100 UTC 25 Mar, and (d) 0000 UTC 26 Mar 2006.
a) FULLTER 0000-1500 UTC b) NOSIERRA 0000-1500 UTC Group X Group Y Group Z Group X Group Y Group Z 2 2 5 1 1 3 3 4 4 1 5 3 2 5 4 2 1 5 3 4 Figure 6. Three-dimensional 15-h (0000−1500 UTC 25 Mar 2006) trajectories from (a) FULLTER and (b) NOSIERRA. Group X forward trajectories (brown) begin at 850 hPa upstream of the Sierra Nevada. Group Y and Z backwards trajectories (green and light green, respectively) terminate at 850 hPa or the half-η level, whichever is higher. FULLTER-NOSIERRA lowest half-η level potential temperature difference (color filled as in Fig. 5) and terrain difference (0–1000m gray, >1000m black). Trajectory layering based on plotting order and does not indicate relative altitude. Trajectories discussed in text and presented in Fig. 7 labeled to left of start position and right of ending arrow.
a) Trajectories 1 & 2 b) Trajectories 3 & 4 Figure 7. Pressure and potential temperature along (a) trajectories 1 and 2 and (b) trajectories 3 and 4 of Fig. 6.
200 200 200 c) FULLTER w/ Anomaly 1500 UTC a) FULLTER 1500 UTC b) NOSIERRA 1500 UTC 300 300 300 400 400 400 500 500 500 Pressure (hPa) Pressure (hPa) Pressure (hPa) 600 600 600 700 700 700 800 800 800 900 900 900 .03 hPa s-1 35 m s-1 1000 1000 1000 -8 -6 -4 -2 0 2 4 6 8 -8 -6 -4 -2 0 2 4 6 8 X Y X Y X Y Figure 8. Cross sections along line XY (see Fig. 4 and other figures for locations) at 1500 UTC 25 Mar 2006. (a) FULLTER potential temperature (contours every 2K), total cloud water and ice mixing ratio (gray shaded at .0001, .1, and .2 g kg-1intervals), total diabatic heating rate produced by the explicit moisture scheme and cumulus parameterization (K hr-1, shaded following inset scale), and vectors of along-section wind and pressure vertical velocity (following inset scale). (b) Same as (a) except for NOSIERRA. (c) FULLTER potential temperature [as in (a)] and FULLTER-NOSIERRA potential temperature difference (K, shaded following inset scale). Shading over Sierra Nevada indicates region where differences in the height of the half-ηsurfaces contribute to the anomaly and introduce a false positive bias.
288 296 288 296 288 296 288 296 20 ms-1 10 50 0 45 50 40 -10 30 35 -20 30 10 -30 25 20 -10 -40 15 -50 -30 10 -60 5 -50 -70 a) FULLTER Cloud/Radar 1800 UTC b) NOSIERRA Cloud/Radar 1800 UTC Y Y X X d) NOSIERRA Kinematic (Fw) 1800 UTC c) FULLTER Kinematic (Fw) 1800 UTC e) FULLTER Diabatic (FD) 1800 UTC f) NOSIERRA Diabatic (FD) 1800 UTC Figure 9. Same as Fig. 4 except for 1800 UTC 25 Mar 2006.
200 200 a) FULLTER 1800 UTC b) NOSIERRA 1800 UTC 300 300 400 400 500 500 Pressure (hPa) Pressure (hPa) 600 600 700 700 800 800 900 900 .03 hPa s-1 35 m s-1 1000 1000 -8 -6 -4 -2 0 2 4 6 8 -8 -6 -4 -2 0 2 4 6 8 X Y X Y 200 c) FULLTER w/ Anomaly 1800 UTC 300 400 500 Pressure (hPa) 600 700 800 900 1000 X Y Figure 10. Same as Fig. 8 except for 1800 UTC 25 Mar 2006.
288 296 304 288 296 Y 200 100 0 -100 X -200 a) FULLTER-NOSIERRA 1800 UTC Y X b) FULLTER-NOSIERRA 2100 UTC Figure 11. FULLTER lowest half-η level potential temperature (every 2 K) and FULLTER-NOSIERRA surface heat flux difference [W m-2, shaded according to scale in (a)] at (a) 1800 UTC 25 Mar and (b) 2100 UTC 25 Mar 2006.
296 304 288 288 304 296 296 296 288 296 296 304 304 288 20 ms-1 10 50 0 45 50 40 -10 30 35 -20 30 10 -30 25 20 -10 -40 15 -50 -30 10 -60 5 -50 -70 a) FULLTER Cloud/Radar 2100 UTC b) NOSIERRA Cloud/Radar 2100 UTC Y Y A A X X d) NOSIERRA Kinematic (Fw) 2100 UTC c) FULLTER Kinematic (Fw) 2100 UTC e) FULLTER Diabatic (FD) 2100 UTC f) NOSIERRA Diabatic (FD) 2100 UTC Figure 12. Same as Fig. 4 except for 2100 UTC 25 Mar 2006.
200 200 200 c) FULLTER w/ Anomaly 2100 UTC a) FULLTER 2100 UTC b) NOSIERRA 2100 UTC 300 300 300 400 400 400 500 500 500 Pressure (hPa) Pressure (hPa) Pressure (hPa) 600 600 600 700 700 700 800 800 800 900 900 900 .03 hPa s-1 35 m s-1 1000 1000 1000 -8 -6 -4 -2 0 2 4 6 8 -8 -6 -4 -2 0 2 4 6 8 X Y X Y X Y Figure 13. Same as Fig. 8 except for 2100 UTC 25 Mar 2006.
200 -70 -60 -50 -40 -30 -20 -10 300 0 400 Pressure (hPa) 500 10 600 20 700 800 900 30 1000 Figure 14. FULLTER (red) and NOSIERRA (blue) skew T–log p diagram (temperature and dewpoint) for point A (see Figs. 5c and 12c,d for location) at 2100 UTC 25 Mar 2006.
a) FULLTER 5 5 2 2 1 1 6 6 4 4 3 3 11 11 10 10 12 12 7 7 9 9 8 8 15 15 16 16 14 14 17 17 13 13 19 19 21 21 18 18 20 20 22 22 25 25 23 23 24 24 Group A Group B Group C Group D Group E 28 28 29 29 27 27 26 26 Update w/ Same color Scale as Fig. 5 Update Fig. Cap following Fig. 6 30 30 31 31 32 32 b) NOSIERRA 8 8 6 6 4 4 2 2 -2 -2 Group A Group B Group C Group D Group E Figure 15. Three-dimensional nine-hour trajectories ending at 2100 UTC. (a) FULLTER and (b) NOSIERRA. Trajectory number indicated to right of trajectory ending arrow. FULLTER-NOSIERRA lowest half-η level potential temperature difference (color filled following inset scale) and terrain difference shaded (0–1000m gray, >1000m black).
296 288 288 304 296 304 296 288 296 288 304 304 20 ms-1 10 50 0 45 50 40 -10 30 35 -20 30 10 -30 25 20 -10 -40 15 -50 -30 10 -60 5 -50 -70 a) FULLTER Cloud/Radar 0000 UTC b) NOSIERRA Cloud/Radar 0000 UTC Y Y X X d) NOSIERRA Kinematic (Fw) 0000 UTC c) FULLTER Kinematic (Fw) 0000 UTC c) FULLTER Diabatic (FD) 0000 UTC e) FULLTER Diabatic (FD) 0000 UTC d) NOSIERRA Diabatic (FD) 0000 UTC f) NOSIERRA Diabatic (FD) 0000 UTC Figure 16. Same as Fig. 4except for 0000 UTC 26 Mar 2006.
294 10 10 10 10 294 294 294 b) NOSIERRA a) FULLTER d) NOSIERRA-FKDRY c) FULLTER-FKDRY 20 ms-1 Figure 17. Lowest half-η level potential temperature (thin contours every 2 K), potential temperature gradient magnitude [thick contours every 5 K (100 km)-1 beginning with 10 K (100 km)-1], wind [vector scale at upper left of (a)], and kinematic frontogenesis [K (100 km h)−1, shaded following scale in Fig. 4c] from (a) FULLTER, (b) NOSIERRA, (c) FULLTER-FKDRY, and (d) NOSIERRA-FKDRY at 0000 UTC 26 Mar 2006.
200 200 200 c) FULLTER w/ Anomaly 0000 UTC a) FULLTER 0000 UTC b) NOSIERRA 0000 UTC 300 300 300 400 400 400 500 500 500 Pressure (hPa) Pressure (hPa) Pressure (hPa) 600 600 600 700 700 700 800 800 800 900 900 900 .03 hPa s-1 35 m s-1 1000 1000 1000 -8 -6 -4 -2 0 2 4 6 8 -8 -6 -4 -2 0 2 4 6 8 X Y X Y X Y Figure 18. Same as Fig. 8 except for 0000 UTC 26 Mar 2006.