Download
1 / 14
140 likes | 330 Vues
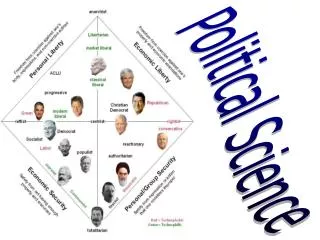
Political Science 30: Political Inquiry. Isolating Causal Factors. Using Tables to “Hold Constant” a Confounding Variable Income and voting Education as a confound Using Graphs to “Hold Constant” A Confound or Another Causal Factor California Connected charts.

E N D
Isolating Causal Factors • Using Tables to “Hold Constant” a Confounding Variable • Income and voting • Education as a confound • Using Graphs to “Hold Constant” A Confound or Another Causal Factor • California Connected charts
Using Tables to “Hold Constant” a Confounding Variable • We want to test the hypothesis that “Americans who have higher incomes are more likely to vote.” • IV: Level of Income • DV: Likelihood of Voting Income Likelihood of Voting
Using Tables to “Hold Constant” a Confounding Variable • Wolfinger and Rosenstone present evidence of the bivariate correlation between income and voting.
Using Tables to “Hold Constant” a Confounding Variable • But wait! Education is a possible confounding variable because (Lecture #2): • Education changes the likelihood of voting • Education is correlated with income • Education is causally prior to income Education Voting Income
Using Tables to “Hold Constant” a Confounding Variable • Thought Experiment: What if we could compare the voting behavior of two people who had the same level of education but different incomes? • Me vs. my friends who went to law school • This analysis “holds constant” education • It isolates the effect of income on voting • Same logic as experiments, natural experiments, and quasi-experiments
Using Tables to “Hold Constant” a Confounding Variable • Wolfinger and Rosenstone hold education constant by using a two-way table.
Using Tables to “Hold Constant” a Confounding Variable • Once they held education constant, they found that “rock bottom poverty seems to depress turnout somewhat. Beyond that, income does not have much effect on turnout. (p. 26)” • Holding constant (or “controlling for”) a confound or another causal factor often teaches us about the bivariate correlation.
Using Graphs • A scatterplot is one way to tell if two interval or ratio variables are correlated.
Using Graphs • Line graphs tell us about trends over time, but watch the scale!
Using Graphs Bar graphs are helpful when your independent variable is nominal
Using Graphs to “Hold Constant” A Confound or Another Causal Factor • I wanted to see whether the presence of term limits (IV #1) made California’s Legislature less likely to alter the Gov’s budget (DV). Term Limits % altered Divided/Unified Government (IV #2)
Using Graphs to “Hold Constant” A Confound or Another Causal Factor