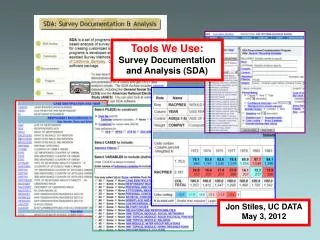
Survey Documentation and Analysis (SDA)
740 likes | 771 Vues
Survey Documentation and Analysis (SDA). Workshop Agenda. Overview What is online analysis? Available SDA data sets Statistical procedures (Frequencies, Crosstabs, Regression) Recoding, subsetting, downloading Teaching resources for SDA and developing instructional materials. SSRIC.

Survey Documentation and Analysis (SDA)
E N D
Presentation Transcript
Workshop Agenda • Overview • What is online analysis? • Available SDA data sets • Statistical procedures (Frequencies, Crosstabs, Regression) • Recoding, subsetting, downloading • Teaching resources for SDA and developing instructional materials
SSRIC Social Science Research & Instructional Councilhttp://www.ssric.org
The Council • Oldest CSU discipline council • Founded in 1972 • Representatives from CSU campuses meet three times per year • Negotiates with data providers for access to data • Promotes use of data analysis in research and teaching
The Council • Annual student research conference • at CSU Long Beach in 2008 • at CSU Sacramento in 2009 • Sponsors travel to ICPSR summer workshops in Ann Arbor, Michigan • http://www.ssric.org/participate/icpsr_summer • Works with Field Research • Question credits to California Field Poll • Selects faculty fellow
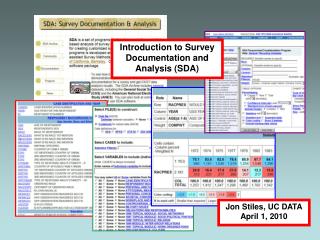
What is Online Analysis? • “Online data analysis" refers to the ability to perform statistical analysis using special Web-based software as an alternative to downloading data into a standalone statistical package on your computer. • The software we’re using is called Survey Documentation and Analysis (SDA), which was developed at the University of California, Berkeley.
Alternative Statistical Packages • You can get a complete list of available online statistical packages at http://statpages.org/ • Some of these include: • OpenStat • ViSta • Statext • SISA
Advantages • Many like SDA are free – don’t require a site license • Only require a computer with an internet connection • Some like SDA are easy to learn • Can show students how to use some of them in 30 minutes or less
Disadvantages • Some online statistical packages (certainly not all) are limited in what they can do statistically • Documentation is not very good for some • Some (like SDA) can only be used with data sets that have already been created in a format that can be read by that package
SDA Data Sets • While SDA is an extremely easy statistical package to learn to use, it’s difficult to create SDA data sets. • You have to purchase a SDA site license to create a data set and then learn how to use it. • So we typically use SDA data sets that have been created for us.
Sources for SDA Data Sets • SDA Archive located at UC Berkeley (http://sda.berkeley.edu/archive.htm) • ICPSR Topical Archives (http://www.icpsr.org/cocoon/ICPSR/all/archives.xml) • Field data located at UC Berkeley (http://ucdata.berkeley.edu/data_record.php?recid=3#analyze) • List of SDA data sets at CSU Long Beach (http://www.csulb.edu/library/eref/datasets.html) • University of Denver’s IDEA project (http://www.du.edu/idea/data.htm
SDA Archive at UC Berkeley (http://sda.berkeley.edu/archive.htm) • GSS Cumulative Datafile (1972-2008; 2008 is a preliminary version). • ANES Cumulative Datafile (1948-2000) and ANES datafiles for 1996, 2000, and 2004. • Census microdata including 2000-2003 American Community Surveys and 1990 and 2000 U.S. 1% PUMS with separate files for 2000 and 1990 California PUMS.
ICPSR • National Archive of Computerized Data on Aging (http://www.icpsr.umich.edu/NACDA/) • National Archive of Criminal Justice Data (http://www.icpsr.umich.edu/NACJD/) • Substance Abuse and Mental Health Data Archive (http://www.icpsr.umich.edu/SAMHDA/) • International Archive of Education Data (http://www.icpsr.umich.edu/IAED/)
Field Datahttp://ucdata.berkeley.edu/data_record.php?recid=3#analyze • Field Polls from 1956 through 2006 are available as publicly-accessible SDA data sets • More recent Field Polls are available as SPSS data sets (through FTP) for CSU faculty, staff, and students.
Other Sources of SDA Data Sets at ICPSR • Voting Behavior: The 2004 Election by Charles Prysby and Carmine Scavo (http://www.icpsr.umich.edu/SETUPS/) • Investigating Community and Social Capital by Lori Weber (http://www.icpsr.umich.edu/ICSC/index.htm)
Available Statistical Procedures • Frequencies and crosstabulation (discussed in this workshop) • Comparison of means • Correlation matrix • Comparison of correlations • Multiple regression (discussed in this workshop) • Logit/Probit regression
Using SDA • Select the data set • Look at the codebook • Decide what statistical procedure to use • Fill in what you want to do • Run it
Data Set • We’re going to use the GSS 1972-2008 Cumulative Data File (2008 is preliminary data) • http://sda.berkeley.edu/archive.htm • We’re going to use three variables • SEX • RELITEN • PORNLAW
Frequencies • List the variables you want to use • ROW: SEX,RELITEN,PORNLAW • Click on “Run the Table”
Crosstabs • Now let’s use RELITEN as our independent variable and PORNLAW as our dependent variable to create two bivariate crosstabulations. • List the variables • ROW: PORNLAW • COLUMN: RELITEN
Crosstabulation Continued • Options • Percentaging: column • Statistics • Question text • Color coding • Run the Table
Your Turn • Let’s run two more bivariate crosstabs • Independent variable: SEX • Dependent variables: RELITEN and PORNLAW • Go ahead and run these crosstabs
What Did we Discover? • RELITEN is strongly related to PORNLAW. • SEX is also related to both RELITEN and PORNLAW. • Could the relationship between RELITEN and PORNLAW be spurious? SEX is related to both RELITEN and PORNLAW and could be creating the relationship between RELITEN and PORNLAW. • How do we test this possibility? Let’s run a three-variable crosstabulation with RELITEN as our independent variable, PORNLAW as our dependent variable, and SEX as our control variable.
Multivariate Crosstabulation • List the variables • ROW: PORNLAW • COLUMN: RELITEN • CONTROL: SEX • Options • Percentaging: column • Statistics • Question text • Color coding
Spuriousness • Was the relationship between RELITEN and PORNLAW spurious due to SEX? • How do you know? • Does that mean that the relationship can never be spurious?
Regression • Crosstabulation is used when all the variables are categorical. • What do we do when our variables are continuous (i.e., interval and/or ratio)? • Regression is the answer.
Bivariate Regression • Let’s look at the relationship between the respondent’s socioeconomic status (SEI) and the amount of television one watches (TVHOURS). • List the variables • Dependent: TVHOURS • Independent: SEI • Options • T-Tests • Correlation matrix • Color coding • Question Text
Multivariate Regression • Now let’s add in another variable: SEX • But sex is not a continuous variable. How do we enter a variable like SEX into the regression analysis? Answer: create a dummy variable. • Dummy variables take on the values of 1 and 0.
Creating a Dummy Variable • SEX (d:1) • SEX is the name of the variable to want to make into a dummy variable • d indicates that you want to create a dummy variable • 1 indicates that the value 1 will be assigned the value 1. All other values will be assigned the value 0. • Run the table
ATTEND0 Never1 Less than once a year2 Once a year 3 Several times a year 4 Once a month 5 2 to 3 times a month 6 Nearly Every Wk 7 Every week 8 More than once a week 9 DK/NA (Missing) ATTENDR 1 Seldom (0 to 3) 2 Sometimes (4 to 5) 3 Often (6 to 8) 9 Missing (9) Recoding Existing VariablesExample (from GSS Cumulative File): ATTEND (How often Respondent attends religious services)
Your Turn Recode AGE into the following categories: 1 = 18-29 2 = 30-64 3 = 65 and older Obtain FREQUENCIES for the result
For More Information, See: http://sda.berkeley.edu/HELPDOCS/helpnewv.htm#recode