Download
1 / 84
840 likes | 995 Vues
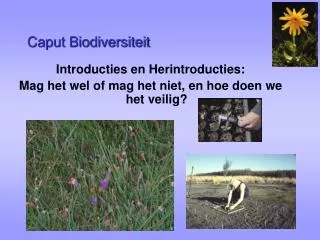
Caput Biodiversiteit 2004 Philippine Vergeer Jan van Groenendael. Caput biodiversiteit colleges 5+6 De paradox van biodiversiteit. biodiversiteitsparadoxen. 1 Biodiversiteit is een continue stijgende functie van de tijd (met enkele onderbrekingen)

E N D
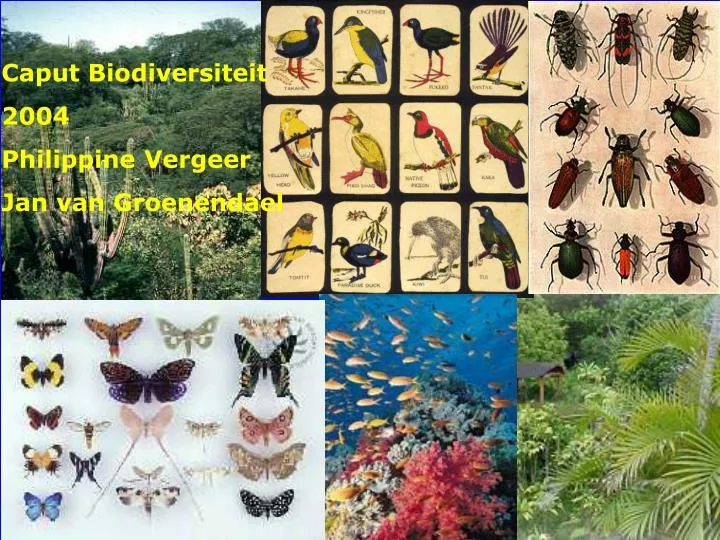
Caput Biodiversiteit 2004 Philippine Vergeer Jan van Groenendael
Caput biodiversiteit colleges 5+6De paradox van biodiversiteit
biodiversiteitsparadoxen 1 Biodiversiteit is een continue stijgende functie van de tijd (met enkele onderbrekingen) 2 Biodiversiteit is functioneel in hoge mate redundant 3 Biodiversiteit is theoretisch tenminste onwaarschijnlijk
biodiversiteitsparadoxen 1 Biodiversiteit is een continue stijgende functie van de tijd (met enkele onderbrekingen) 2 Biodiversiteit is functioneel in hoge mate redundant 3 Biodiversiteit is theoretisch tenminste onwaarschijnlijk
Soortenrijkdom en ecosysteemfunctie After Tilman
Endemisme vs diversiteit rs=0.538 P<0.0001 % endemics No. species
Abundantie vs importantie dominante meeste organisme functionele groepering nuttig Abundantie (gewicht/oppervlakte sleutel- soorten zeldzaam & onbelangrijk Functionele importantie (effect op productiviteit van systeem)
biodiversiteitsparadoxen 1 Biodiversiteit is een continue stijgende functie van de tijd (met enkele onderbrekingen) 2 Biodiversiteit is functioneel in hoge mate redundant 3 Biodiversiteit is theoretisch tenminste onwaarschijnlijk
Sinds Darwin worden interacties tussen soorten doorgaans gedacht vanuit een perspectief van competitie, “Survival of the fittest” Dit heeft vergaande gevolgen gehad voor de ecologische theorievorming over biodiversiteit in de 20ste eeuw
P.F. Verhulst 1838 Notice sur la loi que la population suit dans son acroissement Correspondances Mathematiques et Physiques Logistische groei: Een populatie groeit naar een draagkracht toe: dN/dt = rN (K-N)/K r = intrinsieke groeisnelheid N = populatiegrootte K = draagkracht: ‘carrying capacity’
Interspecifieke competitie: interactie tussen 2 soorten Theoretische biologen, ontwikkelden het logistische model voor populatiegroei en koppelden dit aan het effect van interspecifieke concurrentie ‘het Lotka-Volterra model’ Alfred James Lotka 1880-1949 Vito Volterra 1860-1940
Het Lotka-Volterra model Logistische groei: dN/dt = rN (K-N)/K Nu 2 soorten: soort 1 (met r1, N1 en K1) soort 2 (met r2, N2 en K2) Er is competitie tussen de 2 soorten: een competitie-coefficient: 12 de last die soort 1 van soort 2 ondervindt 21de last die soort 2 van soort 1 ondervindt
Het Lotka-Volterra model Dat geeft voor soort 1: dN1/dt = r1N1 (K1-N1- 12 N2)/ K1 Dat geeft voor soort 2: dN2/dt = r2N2 (K2-N2- 21 N1)/ K2 Onder welke omstandigheden neemt soort 1 toe/af en onder welke omstandigheden soort 2? Als dN1/dt = 0 blijft soort 1 gelijk Als dN2/dt = 0 blijft soort 2 gelijk (het berekenen van de ‘nul-isoclines’)
Het Lotka-Volterra model Dat geeft voor soort 1: dN1/dt = r1N1 (K1-N1- 12 N2)/ K1 dN1/dt = 0 r1N1 (K1-N1- 12 N2)/ K1 = 0 N1 = K1- 12 N2 = 0 N1 = K1 en N2 = K1 /12
Het Lotka-Volterra model Dat geeft voor soort 2: dN2/dt = r2N2 (K2-N2- 21 N1)/ K2 dN2/dt = 0 r2N2 (K2-N2- 21 N1)/ K2 = 0 N2 = K2- 21 N1 = 0 N2 = K2 en N1 = K2 /21
Het Lotka-Volterra model: • 1 stabiel evenwichten • 3 instabiele evenwichten
In 1934 testte de russische ecoloog Georgii Frantsevich Gause (geb.1910) deze theorieën met laboratorium proeven met 2 aan elkaar verwante pantoffeldiertjes (Paramecium aurelia en Paramecium caudatum) De theorieën bleken te kloppen:
2 soorten met gelijke behoeftes (zoals bijv. voedsel) kunnen niet in dezelfde ruimte samenleven: de een zal de ander ‘weg-concurreren’: ‘competitive exclusion principle’ ‘limiting similarity principle’ Ook wel ‘Gause’s exclusion principle’ Georgii Frantsevich Gause (geb.1910)
Lotka-Volterra en het ‘competitive exclusion principle’ zijn sterk gerelateerd aan het ‘ecologisch niche concept’ ecologische niche: het totaal van alles wat een organisme gebruikt van de biotische en abiotische bronnen fundamentele niche: die bronnen die een populatie theoretisch nodig heeft onder optimale omstandigheden realised niche: de bronnen die een populatie op dat moment gebruikt
Competitie heeft een grote invloed op de ecologisch/evolutionaire theorievorming: Door een verandering van eigenschappen kunnen organismen zich aanpassen aan specifieke omstandigheden(‘character displacement’) en zo competitie vermijden ‘character displacement’ kan leiden tot sympatrische soortvorming
Competitie speelt in de natuur aantoonbaar een rol. Waarom is dan toch de competitie-theorie een ongeloofwaardig verklaringsmodel voor biodiversiteit? Welke belangrijke elementen ontbreken aan deze theorie?
niche assembly theory dispersal assembly theory Paradigma shift
Dispersal assembly theorykarakteristieken: • Neutrale theorie • Stochastisch, gericht op alle soorten • Regionaal en patroongevoelig • dispersie paradox
p = patch occupancy c = colonisation probability e = extinction probability ^ ^ p = 1- p c Regionale populatie dynamiek dp = cp(1-p)-ep dt extinction colonisation e
Trade-off (hypothese) verspreidingscapaciteit levensverwachting
1 winnaar rel. abundantie 2 verliezer tijd
1 rel. abundantie 2 3 4 tijd
CORE SATELLITE SPECIES 100 Satellite species (N=72) 10 Intermediate species (N=35) Core species Number of species 1 (N=19) 0.1 0.01 0 10 20 30 40 50 60 70 80 90 Sites occupied (%) Ozinga et al. (in prep.)
core satellite species 60 50 Satellite species Potential species richness (mostly absent) 40 local species richness 30 Average species richness y = 0.61x 2 R = 0.83 20 p < 0.001 Core species 10 (mostly present) 0 0 10 20 30 40 50 60 70 80 90 Regional species pool
Dispersal assembly theorykarakteristieken: • Neutrale theorie • Stochastisch, gericht op alle soorten • Regionaal en patroongevoelig • dispersie paradox
Fractal geometry:-> self-similarity of patterns across scales 100 m 1 m 0.1 m 1000 m
Describing food, habitat abundance:use fractal geometry instead of euclidean geometry Filled Circles, Squares, etc. Slope = 2 Log(Area or “Mass”) Natural landscapes D=Slope = 1.61 Log(Scale of Resolution)
Different spatial arrangements of the same 15% fill Completely random Completely aggregated D =1.90 D =1.37 D =1.40 D =1.63 D =1.90 m m m m m c = - 1.57 c = 0.72 c = 0.83 c = 0.49 c = 0
Potential biodiversity treat:“Euclidination” of natural landscapes 1980 1850
Separation of effects of habitat loss and habitat fragmentation: Dutch heathland landscapes (9x9 km) 34H - Groote Peel 13H - Elspeet/Gortel h=0.16, D=1.94 h=0.17, D=1.83 10H - Engbertsdijksvenen 06H - Uffelterveen 33H - Groote Heide Increasing habitat loss h=0.10, D=1.92 h=0.10, D=1.82 h=0.09, D=1.72 12H - Notterveen 29H - de Hamert 28H - De Bult 3H - Drouwenerveld h=0.06, D=1.89 h=0.05, D=1.80 h=0.04, D=1.74 h=0.05, D=1.61 Increasing fragmentation
The effect is species dependant Diversity of butterflies 2.00 8 8 9 6 12 1.90 12 6 7 7 8 9 12 8 6 10 8 8 1.80 7 8 8 10 7 9 4 Habitat fractal dimension (D) 7 1.70 11 7 9 7 9 1.60 5 4 1.50 5 8 5 5 1.40 0 1 10 100 Total habitat surface (km2) (after Olff et al)
Fragmentation has effectDiversity of breeding birds 2.00 11 12 11 10 12 13 1.90 11 12 10 12 12 13 12 10 11 12 11 10 11 1.80 9 12 11 12 12 Habitat fractal dimension (D) 10 1.70 10 9 11 11 12 1.60 10 10 9 1.50 8 8 7 1.40 0 1 10 100 Total habitat surface habitat (km2) (after Olff et al.)
Species richness vs habitat area and isolation phytophages parasitoids Tscharntke et al 2000
Dispersal assembly theorykarakteristieken: • Neutrale theorie • Stochastisch, gericht op alle soorten • Regionaal en patroongevoelig • dispersie paradox
The Oak, to gain its present most northerly position in North Britain after being driven out by the cold, probably had to travel fully six hundred miles, and this without external aid would take something like a million years (Reid, 1899)
Niche assembly theorykarakteristieken: • Uitsluitings beginsel • Deterministische competitieve hiërarchie, gericht op dominantie • Fitness concept; Beijerinck principe • Lokaal • Hutchingson’s paradox
concurrentie en chaos 1 voedingstof, 2 soorten: 1 winnaar 3 voedingstoffen, 3 soorten: kringetje