Download
1 / 30
300 likes | 547 Vues
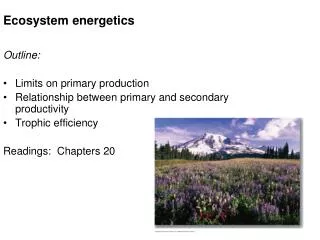
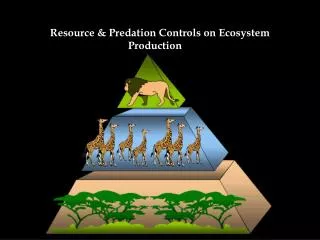
Resource & Predation Controls on Ecosystem Production . Bottom-up Controls – refer to control of abundance or productivity of a species or functional group by supply of resources. Nutrients. What controls production in an ecosystem? . The “bottom up” view of Ecosystem production.

E N D
Resource & Predation Controls on Ecosystem Production Bottom-up Controls – refer to control of abundance or productivity of a species or functional group by supply of resources.
Nutrients What controls production in an ecosystem? The “bottom up” view of Ecosystem production
and Benthic Faunal Biomass mg/m3 Global Ocean distribution of Chlorophyll
“Trickle Up” effectIncreases in primary production propagate through the food web
Nutrients What controls production in an ecosystem? The “bottom up” view of Ecosystem production The “top down” view of Ecosystem production
Top-Down Control & Inferences about Trophic Cascades Hairston, Slobodikin and Smith 1960 • World is Green • But, plants may become depleted whenever herbivores become numerous enough (insect outbreaks, e.g. adelgid) The remaining general method of herbivore control is predation” Basic Premise: “Any population which is not resource limited must, of course, be limited to a level below that set by its resources.” Therefore the “usual condition is for populations of herbivores not to be limited by food supply….” and producers are limited by resources, not herbivores “Predators and parasites in controlling herbivores … must be food limited.”
“Green World Hypothesis” Nutrients Limited by prey availability Limited by predation and parasitism Limited by nutrient availability, not herbivory
“Green World Hypothesis” Nutrients Although the authors did not explicitly call this series of interactions a “trophic cascade” , that was the idea that was implicit in the Green World Hypothesis.
Systems with and without predators Brooks and Dodson (1965) examined 9 lakes: • Four lacked Alewifes • Four had natural Alewife populations • One had introduced Alewifes • sampled before and after the introduction
Alewife Epischura Lepiodore 5 mm DOMINANT ZOOPLANKTERS Dioplomus Cyclops LARGE Mesocyclops Daphnia No Alewife Asplanchna Ceriodaphnia DOMINANT ZOOPLANKTERS Cyclops SMALL Bosmina Tropocyclops Zooplankton Size Distribution in Lakes with: Size-efficiency Hypothesis. Larger zooplankton more effectively graze phytoplankton than smaller zooplankton. Therefore if zooplanktivorous fish are absent, large herbivorous zooplankton will increase and phytoplankton abundance will be reduced. Large zooplankton out compete small zooplankton. Populations of small zooplankton increase in abundance when large zooplankton are depleted.
- Bass Control + Bass A “Trophic Cascade” • If piscivores added to lake, they will eat and deplete zooplanktivorous fish. • Populations of larger herbivorous zooplankton will grow. • Phytoplankton populations will be reduced. Food web manipulations in Peter, Paul and Tuesday Lakes
Food web manipulation experiments of in 3 lakes (from Carpenter et al., 1987. Ecology 68:1863-1876). ZOOPLANKTON PHYTOPLANKTON Control +Bass -Bass Lakes with bass (piscivore added), zooplanktivorous fish depleted, large zooplankton increase, chl a is lower Lakes with piscivore removed have higher chl a
Sea Otters TROPHIC CASCADE IN KELP ECOSYSTEMS and urchin grazers And Killer Whales
Amchitka I. N. Adak I. Kagalaska I. L. Kiska I. 400 300 200 100 0 gms 0.25 m -2 60 50 40 30 20 10 0 Grazing Intensity % Loss 24 hr -1 10 8 6 4 2 0 Total Kelp Density No. per 0.25 m2 1972 1985 1989 1993 1997 Year Effect of Killer whale predation on Sea Otters Sea Otter Abundance 100 80 60 40 20 0 # Otters (% max count) Sea Urchin Biomass From Estes et al. 1998 Science 282:473
But organisms feeding at multiple trophic levels can complicate picture Nutrients H P P C3 C2 CX C1 Links 1 (odd) 2 (even) 3 (odd) 4 (even) - - + - - + - - + + For simple food chains: An odd number of trophic links results in control of primary producers by grazing (top-down) An even number of trophic links results in control of primary producers by resources (bottom-up) And nutrients or other factors limiting producers can still increase producer biomass and have effects that propagate up the food web Both Top-down and Bottom-Up controls influence abundance and productivity of populations Trophic Cascades and Feedbacks
Reasons Why Trophic Cascades Might be Stronger in Aquatic Ecosystems than in Terrestrial Ecosystems • Herbivores are bigger relative to plants in aquatic ecosystems (e.g. zooplankton vs. phytoplankton compared with insects vs. trees) • Aquatic primary producers are more nutritious and have element composition more like their herbivores • Terrestrial plants have lower P:B ratios than aquatic plants (is this a cause or a consequence??) • Aquatic herbivores consume about 3X more autotrophic production than terrestrial herbivores (but why??)
Comparison of Herbivory in Aquatic and Terrestrial Ecosystems (Cyr and Pace, 1993 Nature 361:148) Frequency distributions showing the proportion of NPP removed by herbivores in ecosystems with different primary producers Median, 79% Median, 30% Median, 18%
Regardless of amount of NPP, rates of Herbivory are on average about 3X higher in Aquatic than Terrestrial Ecosystems (note: log scale)
20.0 7.4 2.7 RatioB+predators/B-predatorsfor Plants 0.7% 1.8% 5.0% 13.5% 36.8% 100% Comparative Strength of Trophic Cascades Across Ecosystems based on Manipulations of Predators in Six Types of Ecosystems (102 studies)Plot loge (Abundance+predators/Abundance-predators) • Herbivore response greatest in lentic & marine systems (e.g. density with predators ~6% to13% of that without predators) and least in terrestrial (density + predators ~71% of density - predators) • Plant response greatest in marine benthos (biomass 4.7X > in systems with predators) vs. terrestrial (1.1X > with predators) • Across systems, as Herbivores ⇩ plant biomass response ⇧ (modified from Shurin et al. 2002, Ecology Letters 5:785)
Reasons why we might not ‘see’ top down cascades in land ecosystems Many terrestrial plants have complex structural tissue that is harder to digest and have evolved ‘anti-herbivore’ compounds Perhaps grazing in terrestrial ecosystems is inhibited by Antiherbivore Compounds/Lignin Derivitives
Relative Amount Eaten Effect of Tannins on palatability of grass to Geese From Buchsbaum et al
Reasons why we might not ‘see’ top down cascades in land ecosystems • Many terrestrial apex predators have been hunted to near or local extinction
WOLVES AND WILLOWS 100 50 0 <2 m Percent Browsing 2-3 m 3-4 m 400 200 0 Willow Height (cm) 98 99 00 01 02 03 04 05 Wolves Re-introduced Ripple et al. 2006. For. Ecol & Mgt. 230:96
Reasons why we might not ‘see’ top down cascades in terrestrial ecosystems • Plants have complex tissues and anti-herbivore compounds • Terrestrial may have more complex and more detritus based food webs, less direct grazing. • Many terrestrial apex predators have been hunted to near or local extinction • Longevity of the plant community (decades to centuries for mature plants) makes it hard to measure the results • Terrestrial ecosystems are less experimentally tractable than their aquatic counterparts, in part because of extreme longevity of the plant community • Many of the more charismatic species now enjoy stringent legal protection, which hampers manipulation;
"The ecology of fear" • Defensive strategies to avoid predation • Reduced energy intake • Alternate food sources • Increased susceptibility to other predators • Lower mating success • Emigration
Mummichog Reduction No Trophic Cascade : Creek Infauna Abundance was lower Algae Inverts Mummichog Expected 60 Total Annelids (# / m 2 x 10 3) 40 Observed 20 0 -Fish -Fish Fish Fish Fleeger et al. Accepted JEMBE Reference Nutrient
Nutrients H P P C1 - Behavior alters species roles in ecosystem Algae Mummichog Inverts (Shrimp)
Behavior alters species roles in ecosystem 12 10 Shrimp d15N 8 6 Fish -Fish Fish -Fish Reference Nutrient enrichment Removal of mummichogs allows shrimp to forage in more open areas and become more carnivorous. David JohnsonKari Galvan Linda Deegan
SUMMARY • Top down controls can be important in ecosystem dynamics • Can affect more than just the level below (cascade), including effects on adjoining ecosystems • Interact with nutrient level • Indirect trait mediated effects may be as important as direct consumption effects • Stronger in Aquatic or Terrestrial? No consensus just yet.