Download
1 / 18
180 likes | 273 Vues
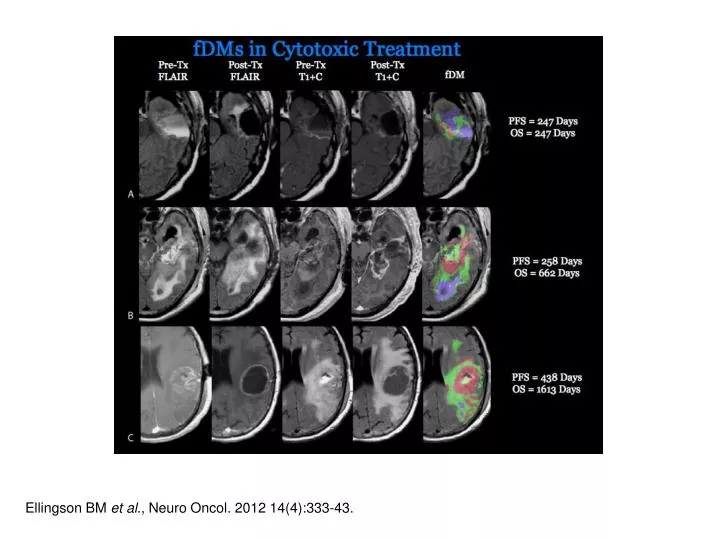
Ellingson BM et al ., Neuro Oncol. 2012 14(4):333-43. Ellingson BM et al ., Neuro Oncol. 2012 14(4):333-43. Ellingson BM et al., Neuro Oncol. 2011 13(10):1151-61. Instead of quantifying the absolute difference in ADC, CIMPLE

E N D
Ellingson BM et al., Neuro Oncol. 2012 14(4):333-43. Ellingson BM et al., Neuro Oncol. 2011 13(10):1151-61
Instead of quantifying the absolute difference in ADC, CIMPLE • maps examines the rate of change and spatial changes in ADC • PROLIFERATION MAPPING uses the CIMPLE map equation, • but assumes no invasion (simplified version of CIMPLE map…need only two time points). • Example: If ADC in one region has decreased from 1.6 to 1.0 um2/ms • over the course of 1 year and another region has a decrease in ADC from 1.6 to 1.0 um2/ms over the course of the last month, fDMs would say these are equally “hypercellular”. CIMPLE maps (or proliferation maps) would say that these two regions have different rates of change in ADC and therefore different proliferation rates. fDMs CIMPLE/ Proliferation Maps