Aerosol_cci2
80 likes | 218 Vues
Aerosol_cci2. L.G. Tilstra and P. Veefkind KNMI. WP1400: User assessment case study 2: Absorbing Aerosol Index 30 year trends. WP1400. Rationale: Assess the added value of the AAI dataset for studies of aerosol absorption trends and variability.

Aerosol_cci2
E N D
Presentation Transcript
Aerosol_cci2 L.G. Tilstra and P. Veefkind KNMI WP1400: User assessment case study 2: Absorbing Aerosol Index 30 year trends
WP1400 Rationale: Assess the added value of the AAI dataset for studies of aerosol absorption trends and variability. Study time series of the AAI to quantify the inter-annual and inter-decadal changes in aerosol absorption.
Plan Create and study time series of more than 30 years of AAI data for selected regions Study the stability of the AAI data records Analyse the variability (inter-annual and inter-decadal) Study and understand differences in AAI retrieved from different satellite sensors and algorithms/settings Simulate AAI time series by modelling AAI using input from chemical transport models Create a multi-sensor AAI data record
AAI products available for constructing long-term time series: *GOME-1: loss of global coverage on 22 June 2003 ; instrument retired on 4 July 2011 Aerosol CCI KO meeting, Oxford, UK, 20 May 2014
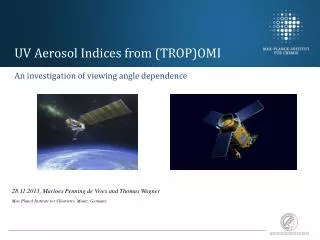
Examples of time series for two selected regions: Siberian forest fires in July 2006 Canadian and Alaskan forest fires June-July 2004 Taklamakan desert Californian forest fires Libian desert Thar desert Rice straw burning Desert dust Sahara Saudi Arabian lowlands Bodélé Sahel biomass burning and desert dust storms Indonesian forest fires A B Amazonian rainforest biomass burning biomass burning smoke biomass burning smoke Smoke and Dust Smoke from forest fires Desert dust and smoke particles are globally the most dominant types of natural aerosols. This map of events is based on absorbing aerosol index information from 2002 to 2009 measured by SCIAMACHY on ESA's Envisat satellite. The detected aerosols originate mainly from desert dust storms and biomass burning events, but also forest fires, such as the ones in Siberia and Canada, and occasional volcanic eruptions. SCIAMACHY was built by Germany, The Netherlands and Belgium. SCIAMACHY AAI over the period 2002–2009 weak events strong events more data and information can be found at www.temis.nl
Region A: Borneo 1997/1998 El Niño: drought caused many forest fires; 120.000 km2 forest burned. (running mean 31 days) Comparison with fire emission estimates for roughly the same region is ok. Van der Werf et al., ACP, 2010 Carbon emission (Tg C / month) Good qualitative agreement. No clear trend visible. High variability. Stability OK.
Region B: West Africa – biomass burning (running mean 31 days) Adding OMI AAI data record: The OMI AAI shows an offset and a smaller “dynamic range” (in the seasonal variation) Combing AAI data from different instruments obviously requires some adaptions and corrections. But, the stability of the individual AAI data records is OK. Aerosol CCI KO meeting, Oxford, UK, 20 May 2014
Lessons learned Lessons learned from Phase 1: The AAI can provide information about the inter-annual and inter-decadal changes in aerosol absorption The AAI data records from all instruments show the stability needed for long-term trend analysis Mixing AAI from the different instruments is feasible but requires careful analysis of the calibration The use of the AAI data records by the climate modelling community is not straightforward and requires a use of the observation operator (AAI simulator)