Monthly Meteorological Data for 2002
120 likes | 137 Vues
Monthly stream lines at 200 hPa and 850 hPa in 2002 with tracks of tropical cyclones superimposed. High-cloud areas on 850 hPa chart.

Monthly Meteorological Data for 2002
E N D
Presentation Transcript
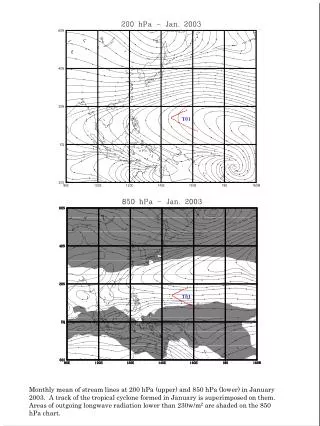
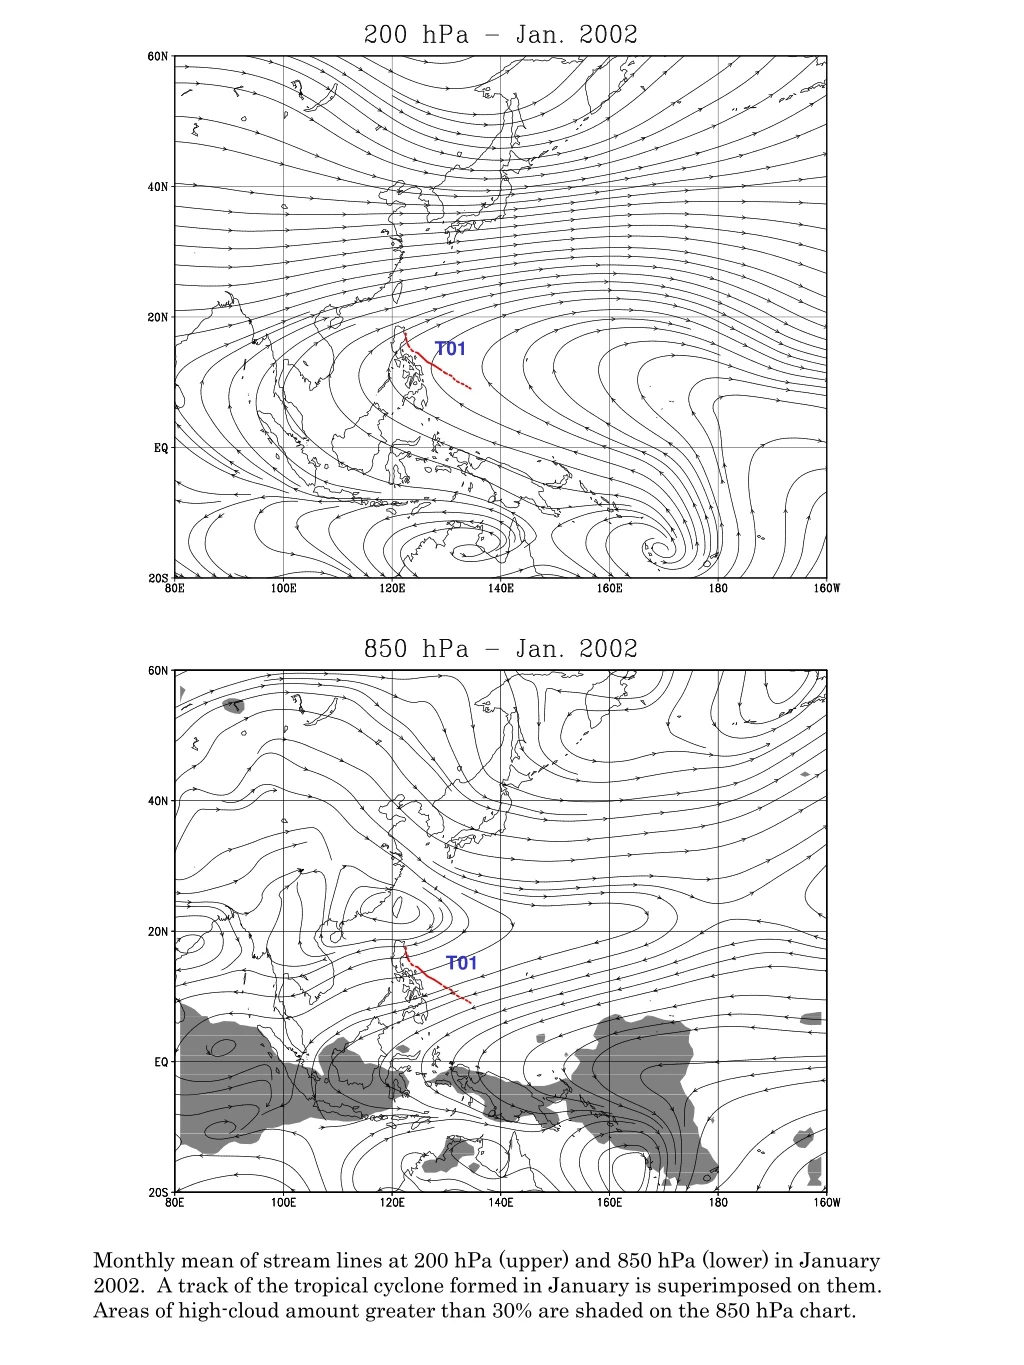
T01 T01 Monthly mean of stream lines at 200 hPa (upper) and 850 hPa (lower) in January 2002. A track of the tropical cyclone formed in January is superimposed on them. Areas of high-cloud amount greater than 30% are shaded on the 850 hPa chart.
T02 T01 T02 Monthly mean of stream lines at 200 hPa (upper) and 850 hPa (lower) in February 2002. A track of the tropical cyclone formed in February is superimposed on them. Areas of high-cloud amount greater than 30% are shaded on the 850 hPa chart.
Monthly mean of stream lines at 200 hPa (upper) and 850 hPa (lower) in March 2002. Areas of high-cloud amount greater than 30% are shaded on the 850 hPa chart.
T06 T07 T05 T04 Monthly mean of stream lines at 200 hPa (upper) and 850 hPa (lower) in April 2002. Areas of high-cloud amount greater than 30% are shaded on the 850 hPa chart.
T03 T03 Monthly mean of stream lines at 200 hPa (upper) and 850 hPa (lower) in May 2002. A track of the tropical cyclone formed in May is superimposed on them. Areas of high-cloud amount greater than 30% are shaded on the 850 hPa chart.
T16 T15 T17 T19 T18 T06 T04 T05 T06 T04 T05 Monthly mean of stream lines at 200 hPa (upper) and 850 hPa (lower) in June 2002. Tracks of the tropical cyclones formed in June are superimposed on them. Areas of high-cloud amount greater than 30% are shaded on the 850 hPa chart.
T07 T09 T08 T11 T10 T07 T09 T08 T11 T10 Monthly mean of stream lines at 200 hPa (upper) and 850 hPa (lower) in July 2002. Tracks of the tropical cyclones formed in July are superimposed on them. Areas of high-cloud amount greater than 30% are shaded on the 850 hPa chart.
T15 T17 T13 T14 T16 T12 T15 T17 T13 T14 T16 T12 Monthly mean of stream lines at 200 hPa (upper) and 850 hPa (lower) in August 2002. Track of the tropical cyclone formed in August are superimposed on them. Areas of high-cloud amount greater than 30% are shaded on the 850 hPa chart.
T21 T19 T20 T18 T21 T19 T20 T18 Monthly mean of stream lines at 200 hPa (upper) and 850 hPa (lower) in September 2002. Tracks of the tropical cyclones formed in September are superimposed on them. Areas of high-cloud amount greater than 30% are shaded on the 850 hPa chart.
T22 T23 T22 T23 Monthly mean of stream lines at 200 hPa (upper) and 850 hPa (lower) in October 2002. Tracks of the tropical cyclones formed in October are superimposed on them. Areas of high-cloud amount greater than 30% are shaded on the 850 hPa chart.
T24 T25 T24 T25 Monthly mean of stream lines at 200 hPa (upper) and 850 hPa (lower) in November 2002. Tracks of the tropical cyclones formed in November are superimposed on them. Areas of high-cloud amount greater than 30% are shaded on the 850 hPa chart.
T26 T26 Monthly mean of stream lines at 200 hPa (upper) and 850 hPa (lower) in December 2002. A track of the tropical cyclone formed in December is superimposed on them. Areas of high-cloud amount greater than 30% are shaded on the 850 hPa chart.