
Climate-Hydropower Covariability in Western U.S.: Energy Transfer Impact
Explore the covariability of climate and hydropower production in the Western U.S. and its impact on energy transfers between regions. By utilizing climate information, this study aims to enhance energy planning efficiency and predictability for hydropower production and energy demand.

Climate-Hydropower Covariability in Western U.S.: Energy Transfer Impact
E N D
Presentation Transcript
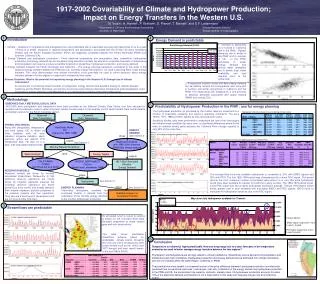
1917-2002 Covariability of Climate and Hydropower Production; Impact on Energy Transfers in the Western U.S. N. Voisin1, A. Hamlet1, P. Graham1, D. Pierce2, T. Barnett2, and D.P. Lettenmaier1 1Department of Civil and Environmental Engineering 2Climate Research Division University of Washington Scripps Institute of Oceanography H13E-0466 1 4 Introduction 1. Climate – Variations in temperature and precipitation are now predictable with a reasonable accuracy with lead times of up to a year ( Pierce et al 2005). Variations in regional temperature and precipitation associated with the El Nino Southern Oscillation (ENSO) and the Pacific Decadal Oscillation (PDO) are negatively correlated between the Pacific Northwest (PNW) and southern California (CA). 2. Energy Demand and hydropower production - From observed temperature and precipitation data, streamflow, hydropower production and energy demand can be simulated using simulation models. By extension, ensemble forecasts of temperature and precipitation can used to produce ensemble forecasts of streamflow, hydropower production, and energy demand. 3. Energy transfers between the Pacific Northwest and California – The energy planning framework considered in this study is the seasonal energy transfer between the PNW and CA. Currently climate information is not used in planning West Coast energy transfers. This study demonstrates how climate information could potentially be used to inform decisions about energy transfers between the two regions on seasonal to interannual time scales. Science Question: What is the potential for improving energy planning in the Western U.S. through use of climate information? As a precursor to producing actual forecasts of hydropower, energy demand and available energy for transfer between California and the Pacific Northwest, we intend to show how useful climate information (temperature and precipitation) could have been in energy planning in the Western U.S. in a retrospective analysis of the 1917-2002 period. Energy Demand is predictable 1. Demand is seasonally out of phase in California and in the PNW. Highest demands are in winter in the PNW and in summer in CA. In the PNW, anomalies in winter energy demand and annual water availability are in phase (high water availability and high demand occur at the same time) 2. A regression analysis shows that daily energy demand can be skillfully derived from temperature, with more skill in summer and winter respectively in California and the PNW. This relationship with temperature is due primarily to electrical demands associated with space heating (PNW) and cooling (CA). 2 Methodology OBSERVED DAILY METEOROLOGICAL DATA 1915-2002 daily precipitation and temperature have been provided by the National Climatic Data Center and then adjusted for elevation and processed in order to reflect long term climatic trends present in the carefully control HydroClimatic Data Center dataset and similar network for the British Columbia section. 5 Predictability of Hydropower Production in the PNW : use for energy planning The hydropower production as simulated by the ColSim reservoir model and is a function of streamflow variability and reservoir operating constraints. The early 1930’s, 1977, 1988 and 2001 appear as very low production years. Hydropower and conventional resources during climate events Observed Daily Precipitation Observed Daily Temperature Sensitivity studies have been performed to understand the role of fish flow targets and initial storage conditions for every year; no significant differences where found even on extreme events partly because the Columbia River storage capacity is only 30% of the mean flow. drives drives Hydrologic Model VIC (Liang et al 1994, 1999) HYDROLOGIC MODEL Along with precipitation, temperature, and wind speed, VIC is driven by other variables such as solar radiation, longwave radiation, vapor pressure, which are derived from temperature data. VIC was run in a daily time step water balance mode. • ENERGY • DEMAND • See Section 4 drives Regression Analysis with 1993-2000 observed PNW daily energy demand May-June-July Hydropower and transfer opportunity during climate events outputs • See Section 3 Monthly Natural Streamflow Water Demand Energy Targets drive outputs CALIFORNIA CVMod (Van Rheenen et al 2004) PACIFIC NORTHWEST ColSim (Hamlet and Lettenmaier 1999) 1917-2002 Simulated Monthly Energy Demand RESERVOIR MODELS Reservoir models are driven by monthly naturalized streamflows. Noteworthy is that California reservoir operations are mostly driven by irrigation demands whereas the Columbia reservoir operations are driven primarily by flood control and energy demand. Both models represent physical properties of the reservoir systems and their operations. They assume a fixed level of development and are run on a monthly time step. The average May-June-July available hydropower is correlated at 20% with ENSO signals and 25% with PDO.The first 1920-1940 period was characterized by a warm PDO signal; This period records the most numerous number of simulated years where no or very little extra hydropower would have been available for transfer to California in early summer. The 1940-1970 period shows a cold PDO signal and has a higher hydropower production average. The last 1970-2000’s period shows greater year to year variability with fluctuating ENSO and PDO signals. ENSO tends to modulate the hydropower variations due to the PDO signal. output Hydropower • See Section 5 derive • ENERGY PLANNING • Theoretical hydropower available for southward transfer is derived form the subtraction of the monthly energy demand to the monthly hydropower production • See Section 5 Available Energy For Southward Transfer 3 Streamflows are predictable VIC simulated runoff is routed to stations as shown on the Columbia River Map. Simulated streamflow at these stations agree well with observations. Climate Signals: ENSO signal ranges from 1 to 3: 1=warm; 3=cold PDO signal ranges from 4 to 6: 4=warm; 6=cold The table shows predictable streamflow patterns based on predictable climate events. Droughts and very wet years correspond to well known events such as the 1930’s and 1977 drought and most recent events in the last 1980’s-2000’s 6 Conclusion Temperature is (relatively) highly predictable. How can long-range (out to a year) forecasts of air temperature anomalies be used to better manage energy transfers between the two regions? Precipitation and temperature are strongly related to climate oscillations. Streamflows can be derived from precipitation and temperature with high confidence. Hydropower production and energy demand can be estimated from climate information and are out of phase within the same Region (California or PNW). The potential economic benefit is a complex function of the price difference between hydropower production and electricity produced from conventional resources ( natural gas, coal, etc). Limitations of the energy transfer are hydropower production in the PNW and CA, the transmission line capacity, contracts, market prices. CA hydropower production accounts for about 10% of the electricity demand and therefore is not a major factor in this study, but may play a larger role at shorter time scales. http://www.abb.com/global/abbzh/abbzh251.nsf!OpenDatabase&db=/global/gad/gad02181.nsf&v=17EA&e=us&m=100A&c=C1256D71001E0037C1256B8000371E41


