Download
1 / 20
200 likes | 235 Vues
CPUC Energy Efficiency Policies and Investor-Owned Utility (IOU) Programs. Senate Committee on Energy, Utilities & Communication Hearing on Energy Efficiency, May 17, 2011. Jeanne Clinton and Simon Eilif Baker California Public Utilities Commission (CPUC).

E N D
CPUC Energy Efficiency Policies and Investor-Owned Utility (IOU) Programs Senate Committee on Energy, Utilities & Communication Hearing on Energy Efficiency, May 17, 2011 Jeanne Clinton and Simon Eilif Baker California Public Utilities Commission (CPUC)
CPUC Process for Approval / Oversight of IOU Energy Efficiency Programs 3-Year Budget Cycle Current cycle: 2010-2012 Next cycle: 2014-2016 (with 2013 “bridge” year)* Portfolio guidance decision: June 2012 (est.) Budget applications: Q1 2013 (est.) Policy Guidance IOU Portfolio Applications 3-Year Portfolio Implementation • Savings Potential / Goals • Strategic Plan • Shareholder Incentives • 20% Third-party • Must meet goals • Budgets / Cost- • effectiveness • Alignment with • Strategic Plan • IOU Administration • Energy Division EM&V • and Oversight *Pursuant to the December 23, 2010 Assigned Commissioner Ruling in Rulemaking (R.) 09-11-014, a 2013 bridge year is expected Slide 2
How the CPUC Sets Direction and Measures Outcomes Efficiency goals set from information on efficiency potential, market assessment, economics. Policy direction based on evaluation findings, stakeholder feedback, gap analysis. Portfolio plans and design/implementation vetted w/ stakeholders; CPUC analyzes for policy consistency. Program designs based on logic models & performance metrics. Utilities report expenditures, installations, estimated savings & key metrics. Program savings verified by independent evaluators managed by CPUC staff. Audit staff assess financial and administrative procedures. Utility performance assessed & incentive paid via Risk Reward Incentive Mechanism. 1. CPUC Resource Goals & Policy Direction 2. Utility Portfolio Planning 5. Utility Risk/Reward Incentive Mechanism CPUC Authorizes 3. Utility Program Design & Implementation 4. CPUC Evaluation, Measurement & Verification Slide 3
Average Annual EE Budget by Funding Source (Total ~ $1 billion) Funding Sources for Mainstream IOU Energy Efficiency Programs • CPUC pools all funding sources into one overall (cost-effective) portfolio • Gas PPP funds lost to budget transfer for FY 11-12 Slide 4
California Long-Term Energy Efficiency Strategic Plan In 2007, CPUC ordered the development of a Strategic Plan to achieve “all cost-effective energy efficiency.” In 2008, Strategic Plan established – A roadmap for energy efficiency through 2020 and beyond Big Bold Energy Efficiency Strategies: Zero Net Energy (ZNE) goals for new & existing buildings Optimization of HVAC system performance Saturation goals for low income household EE Extensive stakeholder engagement via 12 Task Forces Momentum continuing via Action Plans www.californiaenergyefficiency.com Slide 5
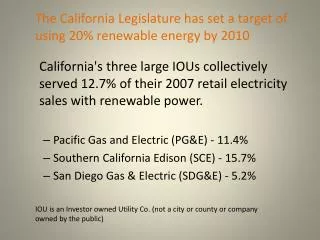
Commission-Adopted IOU Savings Goals* Example: 2020 Energy Savings Goals (kWh)** * Adopted pursuant to P.U. Code Sections 454.55 and 454.56 (SB 1037, Kehoe, Statutes of 2005) **Pursuant to CPUC Decision (D.)08-07-047, as modified by D.09-09-047 Slide 6
2010-2012 IOU Energy Efficiency Portfolios D.09-09-047 approved $3.1 billion in 2010-2012 EE funding (ESAP not included): Three-year combined savings targets: 7,000 GWh / 1,500 MW / 150 MMTherms Equivalent to 3 major power plants Savings incorporated into procurement planning IOUs’ approved portfolios were guided by the Strategic Plan 2010-2012 portfolio is a “transition” portfolio Many new “strategic programs” – e.g., Whole-house retrofit (Energy Upgrade Calif.), ZNE building pilots, on-bill financing (OBF) Slide 7
IOU Forecasted Savings of EE Portfolios Exceed Commission-Adopted Goals Slide 8
*Other includes Codes & Standards; Institutional; Local Government Partnerships (LGPs); Marketing, Education & Outreach (ME&O); Workforce Education & Training (WE&T); Integrated Demand-side Management (IDSM); Lighting Market Transformation; and Evaluation Measurement & Verification (EM&V) Slide 9
2010-2012 EE Portfolio Highlights 12 statewide programs implemented consistently across 4 IOUs • Local government partnerships ($233M); institutional partnerships ($95M) • Third-party programs + Local Government Partnerships ~ 1/3 of portfolio spending by non-utility entities Slide 10
IOU EE Portfolio Organization • Heating, Ventilation, Air Conditioning • New Construction • Emerging Technologies • Codes & Standards • Marketing, Education & Outreach • Workforce Education & Training • Integrated Demand-side Management • Lighting Market Transformation • Residential • Commercial • Industrial • Agricultural Statewide Programs Utility “Local” Programs Third-Party Programs State & Local Gov’t Programs PG&E (7) PG&E (50) PG&E (25) SCE (4) SCE (31) SCE (30) SDG&E (6) SDG&E (14) SDG&E (14) SCG (5) SCG (18) SCG (17) (#) = Number of individual programs
2010-2012 EM&V Objectives Measure & Verify Savings - for load impact and procurement planning Program Evaluation - for timely performance feedback, improvement Market Assessment – For determining baseline, remaining potential, goal-setting Policy and Planning Support – Such as goals studies, DEER database, market transformation insight, and other overarching studies outside of core EM&V Financial and Management Audit – Ensures adherence to CPUC requirement for efficient and effective use of funds (e.g. administrative and marketing cost caps, prudency, etc.) Slide 13
New Focus for EM&V in 2010-2012 Scope: More evaluation of programs in “real time” as implemented Studies of markets for new technologies Pilot use of experimental design and per capita consumption to inform post-2012 program goals and plans Utilizing Program Performance Metrics (PPMs) and Market Transformation Indicators (MTIs) to assess non-energy savings outcomes More rigorous audit of IOU administration activities Approach: Evaluation requirements integrated efficiently into multi-faceted studies Stakeholder input invited into evaluation plans Challenge: Disparity between IOU’s savings projections and evaluated savings widening at increasing rate since 2002 as multiple influences operate in ever-busier EE markets Slide 14
Energy Division Staffing of Demand-Side Management Group Total Staffing: 34 / 51 (Filled / Total Authorized Positions) Demand-Side Programs Branch Demand-Side Analysis Branch Residential Programs (EE, ESAP, DR) 5 / 9 Integrated Demand-Side Analysis (EE, ESAP, DR, DG) 8 / 9 Non-Residential Programs (EE, DR) 6 / 8 Retail Rate Design 3 / 7 Customer Generation Programs (DG) 4 / 7 Demand-side Evaluation (EE, ESAP, DR, DG) 8 / 9 ESAP = Energy Savings Assistance Program DR = Demand Response DG = Distributed Generation (CSI Solar & SGIP) Slide 15
Coordination with CEC Programs & Activities • Codes & Standards (C&S) • C&S advocacy; Codes & Standards Enforcement (CASE) studies • Compliance Enhancement – Training, tools, outreach to building departments • Emerging Technologies Program (ETP) • Commercialization focus; coordinate with PIER through Emerging Technologies Coordinating Council (ETCC) • AB 758 • Financing assessment underway in anticipation of coordinating with CEC on program design • Energy Upgrade California (EUC)* • IOU-administered activities funded by ratepayers - $110M • “Whole-house retrofit” incentives, marketing, training, quality assurance • CEC-administered activities funded by ARRA / SEP - $52M • Marketing, website, financing support, training, (limited) local government incentives • Local government-administered activities funded by ARRA block grants / DOE “Better Buildings” - $40M • (Limited) local government incentives, innovative marketing • ARRA appliance rebates & IOU rebates • Evaluation coordinating group (CEC / CPUC staff) • Lending CPUC expertise / resources to CEC’s limited ARRA evaluation budget • Ensuring no double-counting of savings * Note: EUC is residential and commercial buildings retrofit program and brand. Initially, the program is focused mostly on single-family residential. $ figures are for residential sector only. Slide 16
Commission Staff Planning Activities Extending current portfolio through 2013 or 2014 to allow sufficient time for updated analysis, planning, policy guidance Will require bridge-year funding decision Cost-effectiveness methodology update Database for EE Resources (DEER) update Potential and Goals update Strategic Plan update / Action Plan progress report Post-2012 EM&V approach Slide 17
Looking Ahead… • Market Transformation • Need to distinguish market transformation (MT) from “resource acquisition.” Consider statewide administration of MT approaches? • Innovation • Many promising technologies. How to bring to market and scale-up faster? • New business models for EE program deliverers. Develop protocols for EE aggregators to allow consideration as an energy resource by the ISO? • Competition • Increase competition for highly effective programs to access ratepayer funds in some way? • Utilize 3rd-party program solicitations to drive new program approaches and scaling? • Financing • California needs to find market-specific solutions for EE financing. What is the appropriate ratepayer $ involvement / support? • Need solutions that allow cost repayment by successor owners or tenants. What solutions are they, and how structured? Slide 18
Appendix Slide 19