Download
1 / 22
220 likes | 450 Vues
N O A A ’ s S T A T E O F TH E C O AS T. N a ti ona l Coa st a l P opul a ti o n R eport P opulatio n T re nd s fro m 197 0 t o 202 0. Dear R eade r ,

E N D
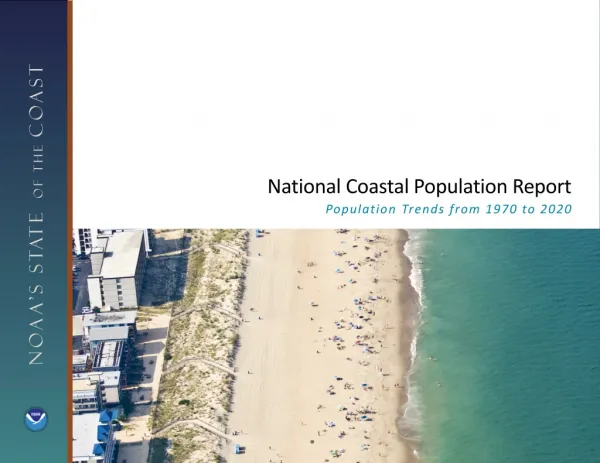
NOAA’s STATE OF THECOAST NationalCoastalPopulationReport PopulationTrendsfrom 1970to2020
Dear Reader, This National Coastal PopulationReport continues the commitmentby NOAA’s National Ocean Service to describe the nation’s coastal population, as a complement to the decadal Census conducted by the U.S. Census Bureau. One of our nation’s ongoing challenges is to manage ecologically sensitive coastal areas such that futuregenerations of Americans will continueto reap the immeasurable economic, cultural, recreational, and aesthetic benefits provided by our coastal resources. At the core of this management challenge are both the large numbers and high densities of residents and visitors at the coast. This concentration of people impacts the integrity of coastal ecosystems, and at the same time, the lives and livelihoods of some of these residents and visitors can be at risk from natural processesat the coast – such as hurricanes, erosion, and sea level rise. Thisreport explores this dynamic relationshipby presenting both the population in Coastal Watershed Counties and in Coastal Shoreline Counties. Joined by our federal and state coastal management partners, we hope this reporting framework will both increaseawareness and enhance policy discussions, by promoting a deeper understanding of our nation’s coastal population. Holly Bamford Assistant Administrator for Ocean Services and Coastal Management National Ocean Service NOAA
TableofContents Our Nation’s Coastal Population How to Use this Document The Bottom Line Coastal Shoreline Counties PopulationPopulation DensityAge Race Hispanic Origin EducationAttainment Household Income Seasonal Housing Building Permits Coastal States Summary Coastal Watershed Counties PopulationPopulation DensityAge Race Hispanic Origin EducationAttainment Household Income Seasonal Housing Building Permits Coastal States Summary Appendix A Appendix B Appendix C 2 3 4 NationalCoastalPopulationReport PopulationTrendsfrom 1970to2020 March 2013 10 This document is a product of the NOAA State of the Coast Report Series, a publication of the NationalOceanic and Atmospheric Administration, Department of Commerce, developed in partnership with the U.S. Census Bureau. Visit: http://stateofthecoast.noaa.gov. 17 18 19
OurNation’sCoastalPopulation HowtoUsethisDocument This report offers two independent sections that present basic demographicstatus and trends informationfor Coastal Shoreline Counties and for CoastalWatershed Counties, allowing the coastal management community the opportunity to choose the appropriate statisticsfor their needs. Our nation’s bountifulcoastal resources have influenced American history and culture, and have drawn a substantialportion of our country’s populationto the coast. The concentration of people and economic activityat the coast places pressures on ecologically sensitive coastal ecosystems and also leavesresidents and visitors vulnerable to coastal hazards, such as hurricanes, erosion, and sea level rise. One focus of this management challenge is to understand who lives at the coast and how this population is changing. However, this is not a simple matter as federal agencies, researchers, and non-governmental organizations define “the coast” in various ways. Appendices A and B provide maps of Coastal Shoreline Counties and CoastalWatershed Counties,respectively. The Coastal Shoreline Counties area subset of Coastal Watershed Counties, and Appendix C provides a simple comparison between these two groups of counties. To increase consistency in how we describe our nation’s coastal population,this report presents the nation’s coastal population in two different lights. One is the population that lives in Coastal Watershed Counties, or thosecounties where a substantialportion of their land area intersect coastalwatersheds, and consequently represent where land use changes andwater quality impacts most directly impact coastal ecosystems. NOAA has historically reported populationfor Coastal Watershed Counties, andcontinues this frameworkin this report. Forthefirsttime,NOAAalso presents the population that lives in a subset of Coastal Watershed Counties, the Coastal Shoreline Counties, or those counties directly adjacent to the open ocean, major estuaries, and the Great Lakes. The Coastal Shoreline Counties,due to their proximity to these waters, bear the most direct effects of coastal hazards and host the majority of economic production associated with coastal and ocean resources. Section 1: People who live in Coastal Shoreline CountiesThis section describes basic demographic status and trends of the U.S. population that resides in 452 Coastal Shoreline Counties (see map in Appendix A). These counties are directly adjacent to the open ocean, major estuaries, and the Great Lakes, and due to their proximity to these waters, bear the most direct effects of coastal hazards and host the majority of economic production associated with coastal and ocean resources. This group of coastal residents could generally be considered “the U.S. population most directly affected by the coast.” When are these statistics most applicable? Providing context for coastal community resilience, coastal hazards, and other ocean resource-dependent issues. Section 2: People who live in Coastal Watershed CountiesThis section describes basic demographic status and trends of the U.S. population that resides in 769 Coastal Watershed Counties. A substantial portion of the land area of these counties intersect coastal watersheds, andconsequently represent where land use changes and water quality impactscan most directly impact coastal ecosystems. This group of coastal residentscould generally be considered “the U.S. population that most directly affects the coast.” When are these statistics most applicable? Providing context for land use changes in coastal watersheds and localwatershed impacts of human activitiesto coastal and estuarine water quality. Channel Islands National Marine Sanctuary and the Channel Islands NationalPark, CA. Credit: Claire Johnson 2 NOAA’s National Coastal PopulationReport
TheBottomLine POPULATIONDENSITYISGROWINGATTHECOAST Regardless of how thecoastis defined, it is substantially more crowdedthan the U.S. as a whole, and population density in coastal areas will continueto increase in the future. In2010: Outofthe3millionmi2 oflandintheUS <10% <20% Within the limited space of the nation’s coast, populationdensity far exceeds the nation as a whole, and this trend will continue into the future. This situation presents coastal managers with the challenge of protecting both coastal ecosystems from a growing population and protecting a growing population from coastal hazards. InJust40Years:1970-2010 or 275,351mi2comprise Coastal Shoreline Counties or 511,971mi2comprise Coastal Watershed Counties Coastal Shoreline Counties added 125persons/mi 2 In2010: Outofthe313millionpeoplelivingintheUS Coastal Watershed Counties added 99persons/mi 2 United States as a whole added 36persons/mi 2 39% 52% 500 400 or 123.3 million people lived in Coastal Shoreline Counties or 163.8 million people lived in Coastal Watershed Counties Persons Per Square Mile 300 In2010: A small amount of land and a large number of people means high density 200 446persons/mi2319persons/mi2 105persons/mi2 100 AllUnitedStatesCounties Each boxrepresents 1 square mile. 0 = 10 persons 1970 1980 1990 2000 2010 2020 Coastal Shoreline Counties Coastal Watershed Counties United States Note: Land area and density values exclude Alaska. Population values include Alaska and US Territories. Source: U.S. Census Bureau, 2011b; NOAA, 2012; Crowell et al., 2010 NOAA’s National Coastal PopulationReport 3
CCooaassttaallSShhoorreelliinneeCCoouunnttiieess Population 123.3million Coastal Shoreline County population in 2010. TheBottomLine Figure 3 Population Change in Coastal Shoreline Counties: 1970-2010 In 2010, 123.3 million people, or 39 percent of the nation’s population lived in Coastal Shoreline Counties.Populationgrowth in these countiesoccurred at a lower rate than the nation as a whole from 1970 to 2010. The populationin Coastal Shoreline Countiesincreased by 34.8 million people, a 39 percent increase, while the nation’s entire population increased by 52 percent over the same timeperiod. 200 100% 80% Percent U.S. Population 39% 160 Million People 120 80 40 60% 40% Percent of the U.S. populationthat resides in Coastal Shoreline Counties in 2010. 20% 0% 0 34.8million Coastal Shoreline County population change from 1970to 2010, a 39% increase. (U.S. average 52%) Figure 4 Percent Population Change in U.S. Counties, Highlighting Coastal Shoreline Counties: 1970-2010 10million Projected population change in Coastal Shoreline Countiesfrom 2010 to 2020, an 8% increase. (U.S. average 10%) Coastal Shoreline County Area Percent -45 - 0 1 - 49 50 - 99 100 - 299 Alaska Hawaii U.S. Territories American Samoa Guam N CNMI Puerto Rico U.S. Virgin Islands 500 0500 0 250 500 0 250 300+ Humpback Whale National Marine Sanctuary. Credit: Fiona Langenberger Note: Includes U.S. Territories. Source: U.S. Census Bureau, 2011b; NOAA, 2012; Crowell et al., 2010 4 NOAA’s National Coastal PopulationReport
CoastalShorelineCounties PopulationDensity 446pers/mi2 Population density of Coastal Shoreline Counties in 2010 (excluding Alaska). (U.S. average 105 pers/mi2excluding Alaska) Figure 5 Population Density Change in Coastal Shoreline Counties and Inland Counties from 1970 to 2020 TheBottomLine 500 450 400 350 300 250 200 150 100 50 0 CoastalShorelineCountiesInlandCounties In 2010, 39 percent of the U.S. population lived in Coastal Shoreline Counties (less than 10 percent of the total land area excluding Alaska). The population density of Coastal Shoreline Counties is over six times greater than thecorresponding inland counties. 37pers/mi2 Persons Per Square Mile Projected population density increase in Coastal Shoreline Counties from 2010 to 2020 (excluding Alaska). 89% Percent increase in the 65 and older population from 1970 to 2010 in Coastal Shoreline Counties.(U.S. average 100%) -4% Percent change in personsyounger than 18 from 1970to 2010 in Coastal Shoreline Counties.(U.S. average 6%) 1970 1980 1990 2000 2010 2020 Note: Density values include U.S. Territories and exclude Alaska. Source: U.S. Census Bureau, 2011b; NOAA, 2012; Crowell et al., 2010 Year Age Figure 6 Percent Population Change of Coastal Shoreline Counties and Inland Coun-tiesby Age from 1970 to 2010 TheBottomLine 120% In 2010, age distribution within Coastal Shoreline Counties and inland countiesdiffered only slightly and the share of the U.S. population living in Coastal Shoreline Countiesby age category was consistent with the share of total population. However, from 1970 to 2010, the growth rate among the agecategories differed substantially, demonstratingan aging population in both Coastal Shoreline Counties and inland counties, with inlandcounties growing faster within each agecategory. CoastalShorelineCountiesInlandCounties 100% Percent Population Change 80% 60% 40% 20% 0% -20% 5 and Under6to17 18 to 24 25 to 34 35 to 44 45 to 54 55 to 64 65 and Older Chatham, MA. Credit: Louis Cafiero Note: U.S. Territories not inlcuded. Source: U.S. Census Bureau, 2011b; NOAA, 2012; Crowell et al., 2010 Age Category NOAA’s National Coastal PopulationReport 5
CCooaassttaallSShhoorreelliinneeCCoouunnttiieess Race 64% Figure 7 80% Percent Population of Coastal Shoreline Counties and Inland Countiesby Race in 2010 Table 1 Share of the U.S. Populationby Race in Coastal Shoreline Counties in 2010 Share of the U.S. Asian Alone population living in Coastal Shoreline Counties. (Share of total U.S. Population 39%) CoastalShorelineCountiesInlandCounties 60% 47% Percent Population 40% Share of the U.S. Black or African American Alone population living in Coastal Shoreline Counties. (Share of total U.S. Population 39%) 20% 0 Asian NativeHawaiian Some OtherAlone and PacificRace Alone Islander Alone Two or More Races White Alone Black or African American Alone American Indian and Alaska Native 211% Alone Race Category Percent increase in Hispanic or Latino population from 1980 to 2010 in Coastal Shoreline Counties. (U.S. average 220%) TheBottomLine Note: The U.S. Census Bureau uses the word “Alone” followingcertain race categories to distiquish those populations that chose a single race to characterize themselves. U.S. Territories not included. Source: U.S. Census Bureau, 2011b; NOAA, 2012; Crowell et al., 2010 In 2010, minority population groups residing in Coastal Shoreline Countiesrepresented a combined 35 percent of the Coastal Shoreline County population.This is higher than the combined share of the total U.S. populationat 28 percent. HispanicOrigin Figure 8 Percent Population of Coastal Shoreline Counties and Inland Countiesby Hispanic or Latino Origin in 2010 Table 2 Share of the U.S. Populationby Hispanic or Latino Origin in Coastal Shoreline Counties in 2010 Hispanic or Latino Non Hispanic or Latino Percent of Population in Coastal Shoreline Counties Percent of Populationin Inland Counties 0 20% 40% 60% Percent Population 80% 100% Miami, FL. Credit: B. O’Grady Note: U.S. Territories not included. Source: U.S. Census Bureau, 2011b; NOAA, 2012; Crowell et al., 2010 6 NOAA’s National Coastal PopulationReport
CoastalShorelineCounties EducationAttainment 38% Figure 9 Percent Population of Coastal Shoreline Counties and Inland CountiesbyEducationAttainment for Those 25 Years and Over in 2010 Table 3 Share of the U.S. Populationby EducationAttainment for Those 25 Years and Over in Coastal Shoreline Counties in 2010 Percent of the population in Coastal Shoreline Countiesthat hold a higher educationdegree in 2010 (for those 25years and over). (U.S. average 35%) 35% 30% CoastalShorelineCountiesInlandCounties Percent Population 25% 20% 13% 15% Percent of the population in Coastal Shoreline Countiesliving below the poverty line in 2010. (U.S. average 13%) 10% 5% 0 e All Some Master’s Bachelor’s Associate’s Some High Professional Doctorat No School High School College Degree Degree Some or Degree Degree School Degree Elementary Graduate Completed 47% Note: Puerto Rico included. Remaining U.S. Territories excluded. Source: U.S. Census Bureau, 2012a; NOAA, 2012; Crowell et al., 2010 EducationAttainment Category Share of the U.S. households making over $100,000 that are in Coastal Shoreline Counties.(Share of total U.S. Households 39%) HouseholdIncome Figure 10 Percent Households of Coastal Shoreline Counties and Inland Countiesby Income in 2010 Table 4 Share of the U.S. Households by Household Income in Coastal Shoreline Counties in 2010 30% Coastal Shoreline CountiesInlandCounties 25% 20% 15% 10% 5% Percent Households 0 Less than $10,000- $25,000- $10,000 $24,999 $49,999 $50,000- $75,000- $74,999 $99,999 Income Category $100,000- $125,000- $150,000+ $124,999 $149,999 Santa Cruz, CA. Credit: K. Crossett Note: U.S. Territories not included. NOAA’s National Coastal PopulationReport 7
CoastalShorelineCounties SeasonalHousing 49.4 million Number of housing units in Coastal Shoreline Counties in 2010, 39% of the U.S. total. Figure 11 Leading States in Number of Seasonal Housing Units in Coastal Shoreline Counties in 2010 Figure 12 Leading States in Percent of Housing Units that are Seasonal in Coastal Shoreline Counties in 2010 Maine North Carolina South Carolina Minnesota Florida Delaware Alaska Oregon Michigan Alabama Florida Michigan New York New Jersey California MassachusettsSouth Carolina Maine New HampshireWashington 18% Percent increase in seasonal housing units in Coastal Shoreline Counties from 2000to 2010. Total housing units in Coastal Shoreline Countiesincreased 8%. 42% Share of all U.S. seasonal homes located in Coastal Shoreline Counties in 2010. 0100200300400500 600 700800 NumberofSeasonalHomes(Thousand) 0 5% 10% Percent 15% 20% Note: U.S. Territories not included. Source: U.S. Census Bureau, 2011a; NOAA, 2012; Crowell et al., 2010 1355 Number of building permits issued per day in Coastal Shoreline Counties from 2000 to 2010. BuildingPermits Figure 13 Building Permits Issued for Single-Family Units in Coastal Shoreline Counties from 2000 to 2010 Figure 14 Building Permits Issued for Multi-Unit Buildings in Coastal Shoreline Counties from 2000 to 2010 1,250 350 300 1,000 250 Building Permits Issued (Thousand) Building Permits Issued (Thousand) 750 200 150 500 100 CoastalShorelineCountiesInlandCounties 250 50 CoastalShorelineCountiesInlandCounties 200220042006 Year 0 0 2000 2008 2010 2000 200220042006 20082010 Year Source: U.S. Census Bureau, 2011c; NOAA, 2012; Crowell et al., 2010 Broadkill Beach, DE. Credit: K. Crossett Note: U.S. Territories not included. 8 NOAA’s National Coastal PopulationReport
CoastalShorelineCounties CoastalStatesSummary Table 5 Demographic Summary of Aggregated Coastal Shoreline Counties by State Source: U.S. Census Bureau, 2011b; NOAA, 2012; Crowell et al., 2010 9
CoastalWatershedCounties PopulationChange 163.8 million 2010 TheBottomLine Figure 15 Population Change in Coastal Watershed Counties: 1970-2010 Coastal Watershed County population in 2010. In 2010, 163.8 million people, or 52 percent of the nation’s population lived in Coastal Watershed Counties.Populationgrowth in these countiesoccurred at a lower rate than the nation as a whole from 1970 to 2010. The populationin Coastal Watershed Countiesincreased by 50.9 million people, a 45 percent increase, while the nation’s entire population increased by 52 percent over the same timeperiod. 100% 200 160 Percent U.S. Population 80% 52% Million People 60% 40% 120 Percent of the U.S. populationthat resides in the CoastalWatershed Counties in 2010. 55% 54% 54% 53% 52% 52% 80 20% 0% 40 0 1970 1980 1990 2000 2010 2020 50.9 million Year Population change in CoastalWatershed Counties from 1970 to 2010, a 45% increase. (U.S. average 52%) Figure 16 Numeric Population Change in U.S. Counties, Highlighting Coastal Watershed Counties: 1970- 15million Projected population change in Coastal Watershed Countiesfrom 2010 to 2020, a 9% increase. (U.S. average 10%) Coastal Watershed County Area Persons -846,000 - 0 Alaska Hawaii 1 - 49,999 U.S. Territories American Samoa Guam 50,000 - 249,999 250,000 - 499,999 N CNMI Puerto Rico U.S. Virgin Islands 0500 0 250 500 0 250 500 Los Angeles County, CA, had the largest singlecounty population growth from 1970 to 2010, increasing by over 2.7 million people. Credit: Bruce Perry, CSULB 500,000 - 2,850,000 Note: Includes U.S. Territories. Source: U.S. Census Bureau, 2011; NOAA, 2012 10 NOAA’s National Coastal PopulationReport
CoastalWatershedCounties PopulationDensity 319pers/mi2 Figure 17 Population Density Change in Coastal Watershed Counties and Inland Counties from 1970 to 2020 Population density of CoastalWatershed Counties in 2010 (excluding Alaska). (U.S. average 105 pers/mi2excluding Alaska) TheBottomLine 400 In 2010, 52 percent of the U.S. population lived in CoastalWatershed Counties (less than 20 percent of the total land area excluding Alaska). The populationdensity of Coastal Watershed Counties is over five times greater than the corresponding inlandcounties, a trend that has beenconsistent since 1970. CoastalWatershedCountiesInlandCounties 350 300 Persons Per Square Mile 24pers/mi2 250 Projected population density increase in Coastal Watershed Counties from 2010 to 2020 (excluding Alaska). 200 150 100 97% 50 Note: Density values include U.S. Territories and exclude Alaska. Source: U.S. Census Bureau, 2011; NOAA, 2012 Percent increase in the 65 and older population from 1970 to 2010 in Coastal Watershed Counties.(U.S. average 100%) 0% 0 1970 1980 1990 Year 2000 2010 2020 Age Figure 18 Percent Population Change of Coastal Watershed Counties and Inland Countiesby Age from 1970 to 2010 Percent change in personsyounger than 18 from 1970to 2010 in Coastal Watershed Counties.(U.S. average 6%) Older TheBottomLine 120% CoastalWatershedCountiesInlandCounties In 2010, age distribution within CoastalWatershed Counties and inland countiesdiffered only slightly and the share of the U.S. population living in Coastal Watershed Countiesby age category was consistent with the share of total population. However, from 1970 to 2010, the growth rate among the agecategories differed substantially, demonstratingan aging population in both Coastal Watershed Counties and inland counties, with inlandcounties growing faster within each agecategory. 100% Percent Population Change 80% 60% 40% 20% 0% -20% 5 and Under6to17 18 to 24 25 to 34 35 to 44 45 to 54 55 to 64 65 and Age Category Port Townsend, WA Credit: D. Nieters Note: U.S. Territories not inlcuded. Source: U.S. Census Bureau, 2011b; NOAA, 2012 NOAA’s National Coastal PopulationReport 11
CoastalWatershedCounties Race 75% Figure 19 Percent Population of Coastal Watershed Counties and Inland Countiesby Race in 2010 Table 6 Share of the U.S. Populationby Race in Coastal Watershed Counties in 2010 Share of the U.S. Asian Alone population living in CoastalWatershed Counties. (Share of total U.S. Population 52%) 80% CoastalWatershedCountiesInlandCounties 60% Percent Population 59% Share of the U.S. Black or African American Alone population living in CoastalWatershed Counties. (Share of total U.S. Population 52%) 40% 20% 0 Asian NativeHawaiian Some OtherAlone and PacificRace Alone Islander Alone Two or More Races White Alone Black or African American Alone American Indian and Alaska Native 239% Alone Percent increase in the Hispanic or Latino populationfrom 1980 to 2010 in CoastalWatershed Counties. (U.S. average 220%) Race Category TheBottomLine Note: The U.S. Census Bureau uses the word “Alone” followingcertain race categories to distiquish those populations that chose a single race to characterize themselves. U.S. Territories not included. Source: U.S. Census Bureau, 2011b; NOAA, 2012 In 2010, minority population groups residing in Coastal Watershed Countiesrepresented a combined 33 percent of the Coastal Watershed County population.This is higher than the combined share of the total U.S. populationat 28 percent. HispanicOrigin Table 7 Share of the U.S. Populationby Hispanic or Latino Origin in Coastal Watershed Counties in 2010 Figure 20 Percent Population of Coastal Watershed Counties and Inland Countiesby Hispanic or Latino Origin in 2010 Hispanic or Latino Non Hispanic or Latino Percent of Population in Coastal Watershed Counties Percent of Populationin Inland Counties 0 20% 40% 60% 80% 100% Shrimp boats in the Gulf of Mexico. Credit: Texas Parks and Wildlife Department Percent Population Note: U.S. Territories not included. Source: U.S. Census Bureau, 2011b; NOAA, 2012 12 NOAA’s National Coastal PopulationReport
CoastalWatershedCounties 37% Percent of the population in Coastal Watershed Countiesthat hold a higher educationdegree in 2010 (for those 25years and over). (U.S. average 35%) 13% Percent of the population in Coastal Watershed Countiesliving below the poverty line in 2010. (U.S. average 13%) 60% Share of the U.S. households making over $100,000 that are in Coastal Watershed Counties.(Share of total U.S. Households 52%) EducationAttainment Figure 21 Percent Population of Coastal Watershed Counties and Inland CountiesbyEducationAttainment for Those 25 Years and Over in 2010 Table 8 Share of the U.S. Populationby EducationAttainment for Those 25 Years and Over in Coastal Watershed Counties in 2010 35% 30% CoastalWatershedCountiesInlandCounties 25% Percent Population 20% 15% 10% 5% 0 Some Master’s Bachelor’s Doctorate Associate’s Some High Professional Some or All No School High School College Degree Degree Degree Degree School Degree Elementary Graduate Completed EducationAttainment Category Note: Puerto Rico included. Source: U.S. Census Bureau, 2012a; NOAA, 2012Remaining U.S. Territories excluded. HouseholdIncome Figure 22 Percent Households of Coastal Watershed Counties and Inland Countiesby Income in 2010 Table 9 Share of the U.S. Households by Household Income in CoastalWatershed Counties in 2010 30% CoastalWatershedCountiesInlandCounties 25% Percent Households 20% 15% 10% 5% 0 Less than $10,000- $25,000- $10,000 $24,999 $49,999 $50,000- $75,000- $100,000- $125,000- $150,000+ $74,999 $99,999 $124,999 $149,999 Income Category Martha’s Vineyard, MA. Credit: K. Crossett Note: U.S. Territo NOAA’s National Coastal PopulationReport 13
CoastalWatershedCounties SeasonalHousing 65.2 million Number of housing units in Coastal Watershed Counties in 2010, 51% of the U.S. total. Leading States in Number of Seasonal Housing Units in CoastalWatershed Counties in 2010 Leading States in Percent of Housing Units that areSeasonal in CoastalWatershed Counties in 2010 Figure 23 Figure 24 Maine Minnesota South Carolina Delaware Florida New Hampshire North Carolina Alaska Michigan Hawaii Florida Michigan California New York New Jersey Massachusetts Maine North Carolina South Carolina Texas 16% Percent increase in seasonal housing units in CoastalWatershed Counties from 2000to 2010. Total housing units in Coastal Watershed Countiesincreased 9%. 55% 0100200300400500 600 700800 NumberofSeasonalHomes(Thousand) 0 5% 10% Percent 15% 20% Share of all U.S. seasonal homes located in CoastalWatershed Counties in 2010. Note: U.S. Territories not included. Source: U.S. Census Bureau, 2011a; NOAA, 2012 1876 BuildingPermits Number of building permits issued per day in CoastalWatershed Counties from 2000 through 2010. Building Permits Issued for Single-Family Units inCoastalWatershed Counties from 2000 to 2010 Building Permits Issued for Multi-Unit Buildings inCoastalWatershed Counties from 2000 to 2010 Figure 25 Figure 26 1,250 350 300 1,000 250 Building Permits Issued (Thousand) Building Permits Issued (Thousand) 750 200 150 500 CoastalWatershedCountiesInlandCounties 100 CoastalWatershedCountiesInlandCounties 250 50 0 0 2000 2002 2004 2006 2008 2010 20002002 20042006 20082010 Year Source: U.S. Census Bureau, 2011c; NOAA, 2012 Mystic Seaport, CT. Credit: J. O’Grady Year Note: U.S. Territories not included. 14 NOAA’s National Coastal PopulationReport
CoastalWatershedCounties CoastalStatesSummary Table 10 Demographic Summary of Aggregated CoastalWatershed Counties by State Source: U.S. Census Bureau, 2011a; NOAA, 2012 15
Acknowledgements References This document was compiled by the following individuals of the NationalOceanic and Atmospheric Administration: Ache, B., K. Crossett,P. Pacheco, J. Adkins, P. Wiley. 2012. “The Coast” is Complicated: A Model to Consistently Describe the Nation’s CoastalPopulation. Estuaries and Coasts. In Press. Kristen CrossettBrent AchePercy PachecoKate Haber Crowell,M.,Coulton,K.,Johnson, C.,Westcott,J.,Bellomo,D.,Edelman,S., and Hirsch, E., 2010. An Estimate of the U.S. Population Living in 100-year Coastal Flood Hazard Areas. Journal of Coastal Research, Vo. 26, No. 2, pp. 201-211. Theauthorswouldliketothankthefollowingindividuals fortheircontributionsto the National Coastal PopulationReport: National Ocean Service, NOAA. 2012. SpatialTrends in Coastal Socioeconomics. Demographic Trends Database 1970-2010; Woods and PooleEconomics, Inc. Projections Database 1970-2040. Available from: http://coastalsocioeconomics.noaa.gov (accessed June 8, 2012). National Oceanic and Atmospheric AdministrationJeff Adkins Chris Clement Theresa Goedeke Alison Hammer John Hayes Susan Holmes Linwood PendletonPeter Wiley U.S. Census Bureau. 2011a. American Community Survey 5-Year Estimates, 2006-2010. Available from: http://factfinder.census.gov/home/saff/main.html?_lang=en U.S. Census Bureau. 2011b. Census 2010. Available from: http://factfinder2.census.gov/faces/nav/jsf/pages/index.xhtml . 2011c. Residential Construction Files 1998-2010. U.S. Census Bureau Thomas FischettiMarc Perry Steven Wilson Federal Emergency Management Agency Mark Crowell PhotoCredits Cover: Ocean City, MD. Credit: Christopher Parypa (Shutterstock) Inside Cover: San Francisco, CA. Credit: D. Nieters Title Page: Lower Mississippi River. Credit: NOAA’s National Ocean Service Chicago coastal skyline. Credit: NOAA’s National Ocean ServiceKayaks in Santa Cruz, CA. Credit: K. Crossett Puerto Rico. Credit: Cary Friday Page 2: Channel Islands NationalPark, CA. Credit: Claire Johnson Cambria, CA. Credit: J. O’Grady San Diego, CA. Credit: J. O’Grady Nubble Light House, Cape Neddick, CA. Credit: J. O’GradyRockport, TX. Credit: Texas Parks and Wildlife Department Page 9: Martha’s Vineyard, MA. Credit: K. CrossettSan Juan, PR. Credit: B. O’Grady Port Aransas, TX. Credit: Texas Parks and Wildlife Department Page 15: San Simeon, CA. Credit: J. O’Grady Anchorage, AK. Credit: D. Nieters San Francisco, CA. Credit: D. Nieters 16 NOAA’s National Coastal PopulationReport
Appendix A: Coastal Shoreline Counties The Federal Emergency Management Agency (FEMA) has derived 452 Coastal Shoreline Counties. FEMA’s 100-year flood plain, or Special Flood Hazard Area (SFHA), delineates where the National Flood Insurance Program’sfloodplain management regulations must be enforced and the area where the mandatory purchase of flood insurance applies. The Coastal Shoreline Countiesare counties that have a coastline bordering the open ocean, or contain FEMA identifiedcoastal high hazard areas in the SFHA (Crowell et al., 2010). American Samoa, Guam, the Commonwealth of the Northern Mariana Islands, the U.S. Virgin Islands, and Puerto Rico are included in this suite (Ache et al., 2012). For more detailed information about Coastal Shoreline Counties visit: http://coastalsocioeconomics.noaa.gov/coast_defined.html. Alaska Coastal Shoreline County U.S. States Hawaii N Note: Coastal Shoreline Counties in the U.S. Territories are not shown. 500 0 250 0 250 500 0500 NOAA’s National Coastal PopulationReport 17
Appendix B: Coastal Watershed Counties NOAA has derived 769 Coastal Watershed Counties. A county is considered a Coastal Watershed County if one of the following criteria is met: (1) at a minimum, 15 percent of the county’s total land area is located within a coastalwatershed; or (2) a portion of a county, or an entire county, accounts for at least 15 percent of a coastal USGS 8-digit cataloging unit. This “15-percent rule” intends to identify counties that have a substantialwatershed-based impact on coastal and ocean resources. In addition, the five U.S. Territories – American Samoa, Guam, the Commonwealth of the Northern Mariana Islands, the U.S. Virgin Islands, and Puerto Rico, are included in their entirety (Ache et al., 2012). For more detailed information about the Coastal Watershed Counties visit:http://coastalsocioeconomics.noaa.gov/coast_defined.html. Alaska Coastal Watershed County Estuarine and Coastal Drainage Areas U.S. States N Hawaii 500 0 250 0 250 500 0500 Note: Coastal Watershed Counties in the U.S. Territories are not shown. NOAA’s National Coastal PopulationReport 18
Appendix C: Comparing Coastal Shoreline and Coastal Watershed Counties Land Area Population Average Density Coastal Shoreline Counties are contained entirely within the inland extent of Coastal Watershed Counties, making up 53 percent of the total land area of Coastal Watershed Counties. However, Coastal Shoreline Countiesexhibit a much higher population density than Coastal Watershed Counties, as theycontain 75 percent of the total population in this area. ti e n s u o P ti e n s o u C L o p a C d n u e d l d e a h CoastalWatershed Counties 319pers/mi2 Coastal Shoreline Counties 446pers/mi2 Note: Land area and density numbersexclude Alaska. Population values include Alaska. A h s ti r r s o e r e n e a t t - a - a 5 W 1 W 1 6 l 2 l a 3 , a t . 0 t s 8 0 s a a 0 m o o i C m l C Coastal ShorelineCounties contain Coastal ShorelineCounties contain i 2 of the CoastalWatershed County land area of the CoastalWatershed County population Alaska Extent of CoastalWatershed Counties Extent of Coastal Shoreline Counties U.S. States Hawaii N 500 0 250 0 250 500 0500 NOAA’s National Coastal PopulationReport 19