Composition of Functions
270 likes | 684 Vues
Composition of Functions. Lesson 4.8. Sometimes it is necessary to write or use two or more functions so you can answer a question or analyze a problem. Time is measured in hours, the radius is measured in kilometers. Suppose an offshore oil well is leaking.

Composition of Functions
E N D
Presentation Transcript
Composition of Functions Lesson 4.8
Sometimes it is necessary to write or use two or more functions so you can answer a question or analyze a problem.
Time is measured in hours, the radius is measured in kilometers • Suppose an offshore oil well is leaking. • Graph A shows the radius, r, of the spreading oil slick, growing as a function of time, t, so r=f(t). • Graph B shows the area, a, of the circular oil slick as a function of its radius, r, so A=g(r). area is measured in square kilometers
Time is measured in hours, the radius is measured in kilometers Suppose you want to find the area of the oil slick after 4 hours. You can use function f on Graph A to find that when t equals 4, r equals 1.5. Next, using function g on Graph B, you find that when r equals 1.5, a is approximately 7. So, after 4 h, the radius of the oil slick is 1.5 km and its area is 7 km2. area is measured in square kilometers
You used the graphs of two different functions, f and g, to find that after 4 h, the oil slick has area 7 km2. You actually used the output from one function, f, as the input in the other function, g. This is an example of a composition of functions to form a new functional relationship between area and time, that is, a=g(f(t)). The symbol g(f(t)), read “g of f of t,” is a composition of the two functions f and g. The composition g(f(t)) gives the final outcome when an x-value is substituted into the “inner” function, f, and its output value, f (t), is then substituted as the input into the “outer” function, g.
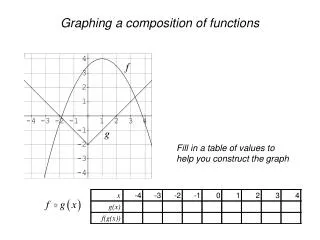
Example A Consider these functions: and What will the graph of y =g(f(x)) look like?
Function f is the inner function, and function g is the outer function. Use equations and tables to identify the output of f and use it as the input of g.
Use ideas about transformations to get the specific equation for y=g(f(x)). Use the parent function y =|x|, translate the vertex right 4 units, and then dilate horizontally by a factor of 4 and vertically by a factor of 3. This gives the equation
You can algebraically manipulate this equation to get the equivalent equation which is the equation of f substituted for the input of g. You can always create equations of composed functions by substituting one equation into another.
Procedural Note • 1. Place the mirror flat on the floor 0.5 m from a wall. • 2. Use tape to attach tape measures or meter sticks up the wall to a height of 1.5 to 2 m.
Looking Up • First, you’ll establish a relationship between your distance from a mirror and what you can see in it. • Set up the experiment as in the Procedure Note. • Stand a short distance from the mirror, and look down into it. Move slightly left or right until you can see the tape measure on the wall reflected in the mirror.
Have a group member slide his or her finger up the wall to help locate the highest height mark that is reflected in the mirror. Record the height in centimeters, h, and the distance from your toe to the center of the mirror in centimeters, d.
Change your distance from the mirror and repeat the last step. Make sure you keep your head in the same position. Collect several pairs of data in the form (d, h). Include some distances from the mirror that are small and some that are large. • Find a function that fits your data by transforming the parent function h=1/d. Call this function f.
Now you’ll combine your work from previous steps with the scenario of a timed walk toward and away from the mirror. • Suppose this table gives your position at 1-second intervals: • Use one of the families of functions from this chapter to fit these data. Call this function g. It should give the distance from the mirror for seconds 0 to 7.
Let (4.7,30) represent the vertex and correspond vertex (0,0) on the parent function d=g(t). The vertex has shifted 4.7 units to the right and 30 units up. • Let (1,112) represent another point on the parabola and correspond with (-1,1) on the parent function. • Considering the data points (4.7, 30) and (1, 112) that the graph as been stretched horizontally by a factor of 3.7 units and vertically by 82 units. 4.7 30
Combining these scale factors with the translations yields: 4.7 30
Use your two functions to answer these questions: • How high up the wall can you see when you are 47 cm from the mirror? • Where are you at 1.3 seconds? • How high up the wall can you see at 3.4 seconds?
Change each expression into words relating to the context of this investigation and find an answer. Show the steps you needed to evaluate each expression. • f(60) • g(5.1) • f (g(2.8)) how high up the wall you can see when you are 60 cm from the mirror; 123 cm your distance from the mirror at 5.1 s; 31 cm how high you can see up the wall at 2.8 s; 143 cm
Find a single function, H(t), that does the work of f(g(t)). • Show that H(2.8) gives the same answer as Step 7c above.
To find the domain and range of a composite function, you must look closely at the domain and range of the original functions.
Example A • Let f (x) and g (x) be the functions graphed below. What is the domain of f(g(x))? Identifying the domain of the outer function, f(x). Domain: -1≤x≤2. Range: 0≤ f(x) ≤3.8. Identifying the domain of the inner function, g(x). Domain: 1≤x≤5. Range: 1≤ g(x)≤3. These range values of g become the input for the outer function, f(x). Notice that not all of these output values lie in the domain of f (x), those greater than 2.
Example A • Let f (x) and g (x) be the functions graphed below. What is the domain of f(g(x))? Identifying the domain of the outer function, f(x). Domain: -1≤x≤2. Range: 0≤ f(x) ≤3.8. Identifying the domain of the inner function, g(x). Domain: 1≤x≤5. Range: 1≤ g(x)≤3. Now identify the x-values that produced this part of the range of g(x) so that 1≤g(x)≤2. This is the domain of the composite function. The domain is 1≤x≤3.