Download
1 / 1
10 likes | 152 Vues
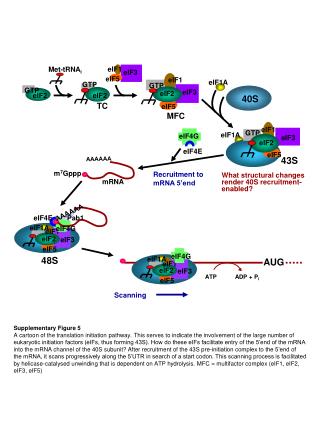
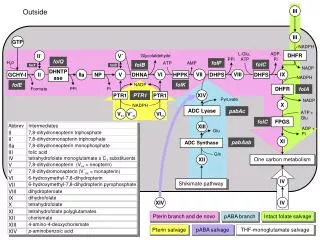
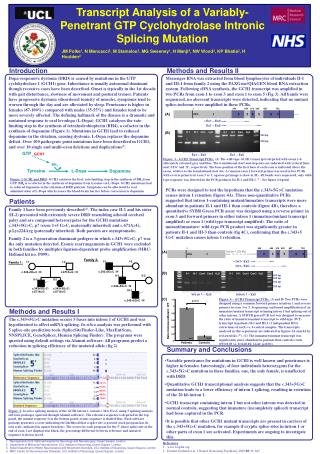
1. 344. 454. 510. 542. 627. 753. 1. 2. 3. 4. 5. 6. ATG. X. Ex1 – Ex3:. Ex1 – Ex5:. II-1. III-1. Con. H 2 O. II-1. III-1. Con. H 2 O. 300 bp. 200 bp. GTP. GCH1. Ex1 – Ex3. Ex1 – Ex5. BH 4. Tyrosine. L-Dopa. Dopamine. 344. 454. 510. 542. 627. 753. 1.

E N D
1 344 454 510 542 627 753 1 2 3 4 5 6 ATG X Ex1 – Ex3: Ex1 – Ex5: II-1 III-1 Con H2O II-1 III-1 Con H2O 300 bp 200 bp GTP GCH1 Ex1 – Ex3 Ex1 – Ex5 BH4 Tyrosine L-Dopa Dopamine 344 454 510 542 627 753 1 Intron 1 (20 kb) 2 3 4 5 6 1 X ATG Int1– Ex3: Int1– Ex5: Family 2: Family 1: I-1 I-2 c.343+5G>C / N c.343+5G>C / N c.671A>G / N II-1 III-1 Con1 Con2 H2O II-1 III-1 Con1 Con2 H2O II-2 500 bp 400 bp II-1 I-1 I-2 300 bp 200 bp 1.2 p<0.01 c.343+5G>C / c.671A>G c.343+5G>C / c.671A>G Intron 1 – Ex3 Intron 1 – Ex5 1 II-1 II-2 0.8 c.343+5G>C / N 0.6 Ratio Immature/Mutant : WT III-1 0.4 c.343+5G>C / N 0.2 n=4 n=6 0 Patients Controls -14.1% -61.8% -90.4% -68.2% -12.6% Transcript Analysis of a Variably-Penetrant GTP Cyclohydrolase Intronic Splicing Mutation MRC Centre for Neuromuscular Disease JM Polke1, N Mencacci2, M Stamelou3, MG Sweeney1, H Manji4, NW Wood2, KP Bhatia3, H Houlden2 Introduction Methods and Results II Dopa-responsive dystonia (DRD) is caused by mutations in the GTP cyclohydrolase 1 (GCH1) gene. Inheritance is usually autosomal dominant though recessive cases have been described. Onset is typically in the 1st decade with gait disturbance, slowness of movement and postural tremor. Patients have progressive dystonia (disordered tonicity of muscle), symptoms tend to worsen through the day and are alleviated by sleep. Penetrance is higher in females (87-100%) compared with males (35-55%) and females tend to be more severely affected. The defining hallmark of the disease is a dramatic and sustained response to oral levodopa (L-Dopa). GCH1 catalyses the rate-limiting step in the synthesis of tetrahydrobiopterin (BH4), a cofactor in the synthesis of dopamine (Figure 1). Mutations in GCH1 lead to reduced dopamine in the striatum, causing dystonia. L-Dopa replaces the dopamine deficit. Over 100 pathogenic point mutations have been described in GCH1, and over 10 single and multi-exon deletions and duplications(1). Messenger RNA was extracted from blood lymphocytes of individuals II-1 and III-1 from family 2 using the PAXGene/QIAGEN blood RNA extraction system. Following cDNA synthesis, the GCH1 transcript was amplified in two PCRs from exon 1 to exon 3 and exon 1 to exon 5 (Fig 3). All bands were sequenced, no aberrant transcripts were detected, indicating that no mutant splice-isoforms were amplified in these PCRs. (A) * (B) Figure. 3 – GCH1 Transcript PCRs: (A) The wild-type GCH1 transcript is depicted with exons 1-6 alternately coloured grey and blue. The translational start and stop sites are indicated with vertical lines and 'ATG' and 'X', respectively. The base position of the first base of each exon is indicated above the exons, relative to the translational start site. A common exon 1 forward primer was used in two PCRs with reverse primers in exon 3 or 5, agarose gel image is show in (B). All bands were sequenced, only wild-type sequence was detected in the PCR products for II-1 and III-1. * - See figure 4 legend. Figure. 1 GCH1 and DRD: GCH1 catalyses the first, rate-limiting, step in the synthesis of BH4 from GTP. BH4 is a cofactor in the synthesis of dopamine from tyrosine via L-Dopa. GCH1 mutations lead to reduced dopamine in the striatum of DRD patients. Symptoms can be alleviated by oral administration of L-Dopa which crosses the blood-brain barrier before conversion to dopamine PCRs were designed to test the hypothesis that the c.343+5G>C mutation causes intron 1 retention (figure 4A). These non-quantitative PCRs suggested that intron 1-containing mutant/immature transcripts were more abundant in patients II-1 and III-1 than controls (figure 4B), therefore a quantitative SYBR Green PCR assay was designed using a reverse primer in exon 3 and forward primers in either intron 1 (immature/mutant transcript amplified) or exon 1 (wild-type transcript amplified). The ratio of mutant/immature: wild-type PCR product was significantly greater in patients II-1 and III-3 than controls (fig 4C), confirming that the c.343+5 G>C mutation causes intron 1 retention. Patients Family 1 have been previously described(2). The index case II-1 and his sister (II-2) presented with extremely severe DRD resembling atheoid cerebral palsy and are compound heterozygotes for the GCH1 mutations c.343+5G>C; p? (exon 1+5 G>C, maternally inherited) and c.671A>G; p.Lys224Arg (paternally inherited). Both parents are asymptomatic. Family 2 is a 3-generation dominant pedigree in which c.343+5G>C; p? was the only mutation detected. Exonic rearrangements in GCH1 were excluded in both families by multiplex ligation-dependent probe amplification (MRC-Holland kit no. P099). (A) * (B) (C) Figure. 4 – GCH1 Transcript PCRs: (A and B) Two PCRs were designed using a common forward primer in intron 1 and reverse primers in exon 3 or 5. Sequencing confirmed amplification of an immature/mutant transcript retaining intron 1 but splicing-out of other introns. A SYBYR green PCR test was designed to measure the ratio of immature/mutant transcript to wild-type (WT) transcript in patients II-1 and III-1 (2 independent RNA extractions of each) vs. 6 control samples. The transcripts analysed in this experiment are indicated in figures 3A and 4A by red asterisks (*). (C) The immature/mutant transcript was significantly more abundant in patients than controls (ratio 0.93±0.03 vs. 0.12±0.02; t-test: p<0.01). Methods and Results I The c.343+5G>C mutation occurs 5 bases into intron 1 of GCH1 and was hypothesised to affect mRNA splicing. In-silico analysis was performed with 5 splice-site prediction tools (SpliceSiteFinder-Like, MaxEntScan, NNSPLICE, GeneSplicer, Human Splicing Finder). The programs were queried using default settings via Alamut software. All programs predict a reduction in splicing efficiency of the mutated allele (fig 2). Summary and Conclusions • Variable penetrance for mutations in GCH1 is well known and penetrance is higher in females. Interestingly, of four individuals heterozygous for the c.343+5G>C mutation in these families, one, the only female, is unaffected with DRD. • Quantitative GCH1 transcriptional analysis suggests that the c.343+5G>C mutation leads to a lower efficiency of intron 1 splicing, resulting in retention of the 20 kb intron 1. • GCH1 transcript containing intron 1 but not other introns was detected in normal controls, suggesting that immature (incompletely spliced) transcript had been captured in the PCR. • It is possible that other GCH1 mutant transcripts are present in carriers of the c.343+5G>C mutation, for example if cryptic splice-sites in intron 1 or other parts of exon 1 are activated. Experiments are ongoing to investigate this. Figure. 2: In-silico splicing analysis of the GCH1 intron 1 variant c.343+5G>C using 5 splicing analysis software packages (queried through Alamut software). The reference sequence is depicted in the top panel, the mutant sequence is in the bottom panel, exonic sequence is shaded blue. Each software package generates a score indicating the likelihood that a splice site is present (each program has its own scale, indicated in square brackets). The scores for each program for the 5' donor splice-site at the end of exon 1 are displayed in black, the percentage difference between reference and mutated sequence is shown in red. • Neurogenetics Unit, National Hospital for Neurology and Neurosurgery, Queen Square, London • Department of Molecular Neuroscience, UCL Institute of Neurology, Queen Square, London • Sobell Department of Motor Neuroscience and Movement Disorders, UCL Institute of Neurology, Queen Square, London • MRC Centre for Neuromuscular Diseases, UCL Institute of Neurology, Queen Square, London • References • www.biophu.org • Trender-Gerhard et al. J Neurol Neurosurg Psychiatry 2009;8039–845