Download
1 / 15
150 likes | 169 Vues
Study on seasonal and diurnal controls on water composition at the fresh-saline water interface. Research conducted at Poleg Well in Netanya, Mediterranean Sea. Field and lab simulations show cation exchange processes and conservative behaviors of ions.

E N D
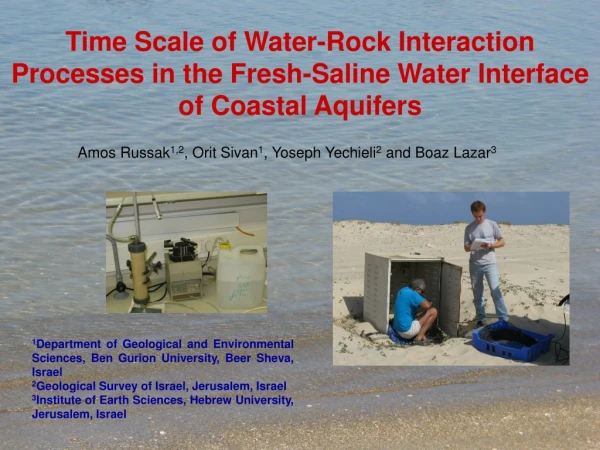
Time Scale of Water-Rock Interaction Processes in the Fresh-Saline Water Interface of Coastal Aquifers Amos Russak1,2, Orit Sivan1, Yoseph Yechieli2 and Boaz Lazar3 1Department of Geological and Environmental Sciences, Ben Gurion University, Beer Sheva, Israel 2Geological Survey of Israel, Jerusalem, Israel 3Institute of Earth Sciences, Hebrew University, Jerusalem, Israel
http://water.usgs.gov/ogw/gwrp/saltwater/fig2.gif Fresh-saline water interface (FSI) Changes in the FSI can happen due to: • Global sea level change. • Big sea storms. • Over exploitation of groundwater. • Seasonal changes in groundwater flow rate. • Tide. (?)
Research Goals • Identifying seasonal and diurnal controls on the chemical composition of water at the FSI. • Quantifying the time scale and the chemical processes in the FSI from field observations and laboratory simulations.
Poleg Well Poleg Research Area • Poleg Well located 70 meters from the shore. • Poleg well depth is about 45 meters and perforated all along the length of the pipe. (Netanya) Mediterranean Sea
Field Methods • Seasonal electrical conductivity profiles. • Seasonal high resolution (15cm) chemical profiles by multi-layer-sampler (MLS). Equilibration with groundwater is less than 1 month. • Diurnal chemical profiles by 3mm diameter pipes and peristaltic pump. Sampling water was done from 6 depths every 2 hours for 28 hours. MLS Cell MLS rod
Ion Exchange Simulations in the Laboratory • A column was filled with sediments from the research area. • The column was saturated with local fresh groundwater. • Seawater was pumped through the column in three experiments using different flow velocities. Experiment are somewhat similar to those of Appelo, with addition of other parameters. • The column was flushed with freshwater after each salinization experiment. 5 experiments
Field Results Electrical Conductivity (mS·cm-1) Depth (m) July January The FSI zone moves vertically.
Seawater Mg2+ (meq·L-1) saline water in the well Fresh water in the well Cl- (meq·L-1) • Most of the results are on a simple mixing line between fresh water and saline water. • The magnesium shows a conservative behavior.
Sea water Ca2+ (meq·L-1) saline water in the well Fresh water in the well Cl- (meq·L-1) • Most of the results are above the mixing line between fresh water and saline water, indicating that cation exchange occur. • The cation exchange time scale is seasonal at most, and possibly also on diurnal scale.
Experiments Results Values of δ13CDIC in seawater and saline groundwater Mg Cl Seawater end member Na Sr Concentration (relative to maximum) δ13CDIC Ca K SO4 δ13CDIC Fresh water end member Pore Volume • Magnesium show a conservative behavior. • Calcium and strontium are enriched. • Negative δ13CDIC imply on organic matter oxidation. • Potssium seem to be delay.
Experiment Results in different velocities ~50 m·y-1 ~200 m·y-1 Concentration (relative to maximum) ~1000 m·y-1 PoreVolume
Cation exchange calculation [Naobs-Naexp] + [Kobs-Kexp] (meq·L-1) [Caobs – Caexp] (meq·L-1) The cation exchange calculated as the difference between the observed cation concentration and the expected concentration (if conservative). Slope of -1 means that the enrichment of calcium is equal to the depletion in potassium and sodium.
Comparison Between Field and Experiments Results Black – exp. Color - field Salinization exp. Ca2+ (meq·L-1) Flushing exp. Cl- (meq·L-1) • There is a good correlation between the field results and the laboratory experiments. • Most of the field results (including the diurnal sampling) show seawater intrusion pattern.
Conclusions • Salinization and flushing experiments simulate very well the field observations in the FSI. • Flushing is expressed as a simple mixing lines between all ions. • Exchange of Ca with (Na + K) is a major process occurring in the FSI during salinization. • Cation exchange is a very fast process occurring even at very high flow rates (1,000 m·y-1 in laboratory experiments).
Thank You For Listening