Weka Package
Discover how to utilize the open-source Weka data mining software using its GUI, command line, or Java code. Learn preprocessing tools, evaluation methods, and explore datasets with Weka's features.

Weka Package
E N D
Presentation Transcript
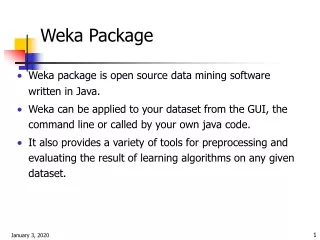
Weka Package • Weka package is open source data mining softwarewritten in Java. • Weka can be applied to your dataset from the GUI, the command line or called by your own java code. • It also provides a variety of tools for preprocessing and evaluating the result of learning algorithms on any given dataset.
Online Documentation • Software website • Book: Data Mining: Practical Machine Learning Tools and Techniques with Java Implementations • User guide for the Explorer GUI • User guide for the Experimenter GUI • ARFF file format • API documentation • Collections of datasets • Weka-related Projects
Input: ARFF file format • The data must be converted to ARFF • Required declarations of @RELATION, @ATTRIBUTE and @DATA • @RELATION declaration associates a name with the dataset • @RELATION <relation-name> • @ATTRIBUTE declaration specifies the name and type of an attribute • @attribute <attribute><data type> • Data type can be numeric, nominal, string or data • @DATA declaration is a single line denoting the start of the data segment • Missing values are represented by ?
Data Example @relation weather @attribute outlook {sunny, overcast, rainy} @attribute temperature real @attribute humidity real @attribute windy {TRUE, FALSE} @attribute play {yes, no} @data sunny,85,85,FALSE,no sunny,80,90,TRUE,no overcast,83,86,FALSE,yes rainy,70,96,FALSE,yes …………
Weka GUI • Strat->Programs->Data Mining Tools->Weka-3-2
Weka GUI - Experimenter • Convenient Environment for creating, running, modifying and analyzing experiments.
Defining an Experiment • Initialize an experiment: click on “new”, system loads the default parameters. • Define dataset to be processed in dataset panel • Select “use relative paths” • Click on “add new”
Saving result of the experiment • Click on the “CSVResultListener” entry in the Destination panel. • Click on “outputFile” in the new popped window • Type the name of the output file, click Select • The file name is displayed in the outputFile panel.
Saving the experiment definition • Select “Save…” at the top of the setup window. • Type the dataset name with the extension “exp” • The experiment can be restored by selecting Open in the setup window and then selecting the file in the dialog window • Click Start to run the experiment.
Running an experiment • Click the Run tab at the top of the window. • The current experiment performs 10 randomized train and test runs on the Iris dataset, using 66% of the patterns for training and 34% for testing, and using the ZeroR scheme. • The results of the experiment are saved to the dataset experiment.txt • The results are generated in comma-separated value (CSV) form and can be loaded into a spreadsheet for analysis.
Changing the Experiment Parameters • Clicking on the ResultGenerator panel. • Click on the splitEvaluator entry to display the SplitEvaluator properties • Click on the classifier entry(ZeroR) to display the scheme properties • Click on the drop-down list for the scheme to select a different scheme.
Adding Additional Schemes • Additional Schemes can be added in the Generator properties panel. • To begin, change the dropdown list entry from Disabled to Enabled in the Generator properties panel. • Click Select property and expand splitEvaluator so that the classifier entry is visible in the property list; click Select. • The scheme name is displayed in the Generator properties panel. • Now when the experiment is run, results are generated for both schemes.
Adding Additional Datasets • The scheme(s) may be run on any number of datasets at a time. • Additional datasets are added by clicking “Add new …” in the Datasets panel. • Datasets are deleted from the experiment by selecting the dataset and then clicking Delete Selected.
Raw Output • The output generated by a scheme can be saved to a file and then examined at a later time • Open the Result Producer window by clicking on the Result Generator panel in the Setup window. • Click on rawOutput and select the True entry from the drop-down list. • By default, the output is sent to the file splitEvaluatorOut.zip. The output file can be changed by clicking on the outputFile panel in the window. • Now when the experiment is run, the result of each processing run is archived.
Instances Result Producer • Results can also be sent to an Instances Result Listener and then analysed by the Weka Experiment Analyser. • Click on the result listener portion of the Destination panel and then select Instances Result Listener. • Then select the output dataset. The dataset extension should be “arff”. • When this experiment is run, results are generated in “arff” format.
Instances Result Producer • @relation InstanceResultListener • @attribute Key_Dataset {iris} • @attribute Key_Run {1,2,3,4,5,6,7,8,9,10} • @attribute Key_Scheme {weka.classifiers.ZeroR} • @attribute Key_Scheme_options {''} • @attribute Key_Scheme_version_ID {6077547173920530258} • @attribute Date_time numeric • @attribute Number_of_instances numeric • @attribute Number_correct numeric • @attribute Number_incorrect numeric • @attribute Number_unclassified numeric • @attribute Percent_correct numeric • … • @data • iris,1,weka.classifiers.ZeroR,'',6077547173920530258,20010205.1546,51,15,36,0,29.411765, • 70.588235,0,0.446239,0.473777,100,100,81.592363,81.592363,0,1.59985,1.59985,0,0,0,0,0,0, • 0,0,1,31,1,20,0,0,0,? • iris,2,weka.classifiers.ZeroR,'',6077547173920530258,20010205.1546,51,11,40,0,21.568627, • 78.431373,0,0.451365,0.480492,100,100,83.584631,83.584631,0,1.638914,1.638914,0,0,0,0,0, • 0,0,0,1,31,1,20,0,0,0,? • iris,3,weka.classifiers.ZeroR,'',6077547173920530258,20010205.1546,51,15,36,0,29.411765, • 70.588235,0,0.446239,0.473777,100,100,81.592363,81.592363,0,1.59985,1.59985,0,0,0,0,0,0, • 0,0,1,35,1,16,0,0,0,?
Experiment Analyzer • Analyze the results of experiments that were sent to an Instances Result Listener • The experiment shown below uses 3 schemes, ZeroR,OneR, and j48.J48, to classify the Iris data in an experiment using 10 train and test runs, with 66%of the data used for training and 34% used for testing.
Experiment Analyzer • Run the experiment. • Analyse tab -> Perform test to generate a comparison of the 3 schemes. • The percentage correct for each of the 3 schemes is shown in each dataset row. • The annotation “v” or “*” indicates that a specific result is statistically better (v) or worse (*) than the baseline scheme at the significance level specified
Cross-Validation Result Producer • Change from random train and test experiments to cross-validation experiments.
Explorer GUI • Explorer GUI: different preparation, transformation and modeling algorithms on a dataset • Experimenter GUI: run different algorithms in batch and to compare the results • Tabs: • Preprocess • Classify • Cluster • Associate • Select attributes • Visualize
Preprocessing • Opening files • Base relation and working relation • Base relation: originally loaded version of data, unchanged during performing actions. • Working relation: copy of base relation, changed when any filters are applied to the data. • Working with attributes • Attributes in base relation • Attributes info for base relation
Working with Filters • Preprocess section allows filters to be defined. • Filters transform the data in various ways. • E.g. DiscretizeFilter - discretizes a range of numeric attributes in the dataset into nominal attributes. • E.g. NominalToBinaryFilter – transform nominal data to n-1 bits binary fileter (n is the number of categories) • Multiple filters can be applied onto data • Transformation results are save in working relation
Classification • Select classification algorithms • Test options • Use training set • Supplied test set • Cross-validation • Percentage split • Click start to run the classification
Classification • The classifier output text • Run information: gives relation name, instances, attributes and test mode. • Classifier model: a textual representation of the model • Summary: a list of statistics summarizing of accuracy • Detailed accuracy by class: more detailed per-class break down of the prediction accuracy. • Confusion Matrix: show how many instances have been assigned to each class.
Clustering • Cluster modes • Ignoring attributes • Learning clusters
Associating • Setting up • Learning association
Selecting attributes • Searching and evaluating • Options • Performing selection
Visualizing • Changing the view • Selecting instances