Download
1 / 14
140 likes | 263 Vues
This guide outlines the selection of statistical process control (SPC) charts for analyzing mental health data. It discusses the types of data including discrete vs. continuous, and whether occurrences and non-occurrences can be counted. The article explains key considerations such as the observations per sub-group, equal areas of opportunity, and group sizes. It also covers various SPC charts like X-bar R, XmR, p-charts, and c-charts to help professionals visualize waiting times, no-shows, referral rates, and more in the mental health sector.

E N D
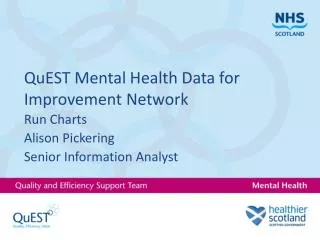
QuEST Mental Health Data for Improvement Network SPC Charts Alison Redpath Senior Information Analyst
Which chart? What type of data? Discrete Continuous Can both occurrences and non-occurrences be counted? How many observations per sub-group? No Yes Are there equal areas of opportunity? Are the sub-groups equal size? 2-10 1 No >10 Yes XbarR chart XmR chart No Yes p-chart XbarS chart np-chart c-chart u-chart
Which chart? What type of data? Measure Count Do we have both pass/fail, yes/no? How manyare represented by one data point? No Yes Is the chance the same for each point? Do all data points represent the same number? 2-10 1 Yes >10 No No Yes XbarR chart XmR chart p-chart XbarS chart c-chart np-chart u-chart
Mental Health likely charts Waiting times breachers per month % p-chart DNA % - p-chart New:follow-up ratio per month p-chart Number of referrals per month c-chart Number of patients on the caseload per month c-chart Total waiting list size c-chart Average waiting time per month XbarR chart Average waiting time per day XbarS chart Waiting time per patient XmRchart
Equations https://www.moresteam.com/toolbox/statistical-process-control-spc.cfm
Rules for interpretation Any point outside the control limits 2/3 points in the outer third 15 consecutive points in the inner third 8 or more above or below the average 6 or more in a trend
Example Number of Adult Psychiatry Appointments DNA'd in NHS Somewhere between January 2011 and January 2013
Further information http://en.wikipedia.org/wiki/Control_chart has a list of different control chart types, with links to how to construct each of them Register with IHI.org and then find the webex On Demand: Using Run and Control Charts to Understand Variation
Further support Alison Redpath Senior Information Analyst QuEST Mental Health 01312443284 alison.pickering@scotland.gsi.gov.uk