Download

1 / 43
430 likes | 571 Vues
IS 4800 Empirical Research Methods for Information Science Class Notes March 16, 2012. Instructor: Prof. Carole Hafner, 446 WVH hafner@ccs.neu.edu Tel: 617-373-5116 Course Web site: www.ccs.neu.edu/course/is4800sp12/. Outline. Sampling and statistics (cont.) T test for paired samples

E N D
IS 4800 Empirical Research Methods for Information Science Class Notes March 16, 2012 Instructor: Prof. Carole Hafner, 446 WVH hafner@ccs.neu.edu Tel: 617-373-5116 Course Web site: www.ccs.neu.edu/course/is4800sp12/
Outline • Sampling and statistics (cont.) • T test for paired samples • T test for independent means • Analysis of Variance • Two way analysis of Variance
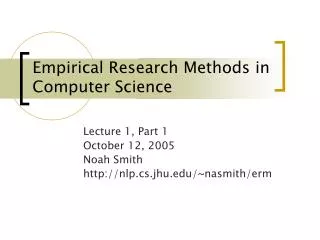
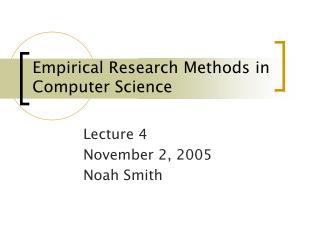
Relationship Between Population and Samples When a Treatment Had No Effect
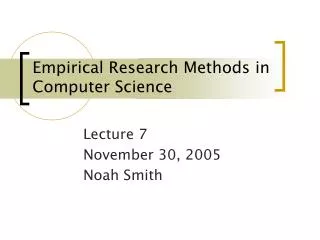
Relationship Between Population and Samples When a Treatment Had An Effect
Mean? Variance? Population m Sample of size N Mean values from all possible samples of size N aka “distribution of means” Sampling MM = m ZM = ( M - m ) /
Z tests and t-tests t is like Z: Z = M - μ / t = M – μ / μ = 0 for paired samples We use a stricter criterion (t) instead of Z because is based on an estimate of the population variance while is based on a known population variance. S2 = Σ (X - M)2 = SS N – 1 N-1 S2M = S2/N
We can compute the distribution of means and finally determine the probability that this mean occurred by chance Now, given a particular sample of change scores of size N We compute its mean df = N-1 T-test with paired samples Given info about population of change scores and the sample size we will be using (N) ? m = 0 S2 est s2 from sample = SS/df S2M = S2/N
Estimate variances of distributions of means t test for independent samples Estimate variance of differences between means (mean = 0) Estimate population variances (assume same) Given two samples This is now your comparison distribution
Estimating the Population Variance S2 is an estimate of σ2 S2 = SS/(N-1) for one sample (take sq root for S) For two independent samples – “pooled estimate”: S2 = df1/dfTotal * S12 + df2/dfTotal * S22 dfTotal = df1 + df2 = (N1 -1) + (N2 – 1) From this calculate variance of sample means: S2M = S2/N needed to compute t statistic S2difference = S2Pooled / N1 + S2Pooled / N2
Compute t = (M1-M2)/SDifference Determine if beyond cutoff score for test parameters (df,sig, tails) from lookup table. t test for independent samples, continued Distribution of differences between means This is your comparison distribution NOT normal, is a ‘t’ distribution Shape changes depending on df df = (N1 – 1) + (N2 – 1)
ANOVA: When to use • Categorial IVnumerical DV (same as t-test) • HOWEVER: • There are more than 2 levels of IV so: • (M1 – M2) / Sm won’t work
Populations are normal Populations have equal variances More or less.. ANOVA Assumptions
Null hypothesis Means of all groups are equal. Test: do the means differ more than expected give the null hypothesis? Terminology Group = Condition = Cell Basic Logic of ANOVA
Experimental Between-subjects Single factor, N-level (for N>2) One-way Analysis of Variance (ANOVA) Two factor, two-level (or more!) Factorial Analysis of Variance AKA N-way Analysis of Variance (for N IVs) AKA N-factor ANOVA Within-subjects Repeated-measures ANOVA (not discussed) AKA within-subjects ANOVA Accompanying Statistics
The Analysis of Variance is used when you have more than two groups in an experiment The F-ratio is the statistic computed in an Analysis of Variance and is compared to critical values of F The analysis of variance may be used with unequal sample size (weighted or unweighted means analysis) When there are just 2 groups, ANOVA is equivalent to the t test for independent means ANOVA: Single factor, N-level (for N>2)
Between-Group Estimate Of Population Variance M1 M2 M3 One-Way ANOVA – Assuming Null Hypothesis is True… Within-Group Estimate Of Population Variance
Using the F Statistic • Use a table for F(BDF, WDF) • And also α BDF = between-groups degrees of freedom = number of groups -1 WDF = within-groups degrees of freedom = Σ df for all groups = N – number of groups
Data Mean
SPSS Results… F(2,21)=9.442, p<.05
Two or more nominal independent variables, each with two or more levels, and a numeric dependent variable. Factorial ANOVA teases apart the contribution of each variable separately. For N IVs, aka “N-way” ANOVA Factorial Designs
Adding a second independent variable to a single-factor design results in a FACTORIAL DESIGN Two components can be assessed The MAIN EFFECT of each independent variable The separate effect of each independent variable Analogous to separate experiments involving those variables The INTERACTION between independent variables When the effect of one independent variable changes over levels of a second Or– when the effect of one variable depends on the level of the other variable. Factorial Designs
Wait Time Sign in Student Center vs. No Sign Satisfaction Example
Example of An Interaction - Student Center Sign – 2 Genders x 2 Sign Conditions F M No Sign Sign
df for between-group variance estimates for main effects Number of levels – 1 df for between-group variance estimates for interaction effect Total num cells – df for both main effects – 1 e.g. 2x2 => 4 – (1+1) – 1 = 1 df for within-group variance estimate Sum of df for each cell = N – num cells Report: “F(bet-group, within-group)=F, Sig.” Degrees of Freedom
Publication format N=24, 2x3=6 cells => df TrainingDays=2, df within-group variance=24-6=18 => F(2,18)=7.20, p<.05
IF you have a significant interaction THEN If 2x2 study: do not report main effects, even if significant Else: must look at patterns of means in cells to determine whether to report main effects or not. Reporting rule
n.s. Results? Sig. 0.34 0.12 0.41 TrainingDays Trainer TrainingDays * Trainer
Significant interaction between TrainingDays And Trainer, F(2,22)=.584, p<.05 Results? Sig. 0.34 0.12 0.02 TrainingDays Trainer TrainingDays * Trainer
Main effect of Trainer, F(1,22)=.001, p<.05 Results? Sig. 0.34 0.02 0.41 TrainingDays Trainer TrainingDays * Trainer
Significant interaction between TrainingDays And Trainer, F(2,22)=.584, p<.05 Do not report TrainingDays as significant Results? Sig. 0.04 0.12 0.01 TrainingDays Trainer TrainingDays * Trainer
Main effects for both TrainingDays, F(2,22)=7.20, p<.05, and Trainer, F(1,22)=.001, p<.05 Results? Sig. 0.04 0.02 0.41 TrainingDays Trainer TrainingDays * Trainer
Not all cells in your design need to be tested But if they are, it is a “full factorial design”, and you do a “full factorial ANOVA” Retrospective Real-Time Agent Ö Ö Text X Ö “Factorial Design”
More than two independent variables are included in a higher-order factorial design As factors are added, the complexity of the experimental design increases The number of possible main effects and interactions increases The number of subjects required increases The volume of materials and amount of time needed to complete the experiment increases Higher-Order Factorial Designs