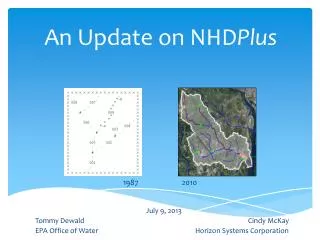
NHDPlus as a Geospatial Framework for Drought Indicators
Explore the integrated suite of application-ready, geospatial surface water data products provided by NHDPlus for drought monitoring and analysis. Utilize the wealth of available data to assess drought conditions effectively.

NHDPlus as a Geospatial Framework for Drought Indicators
E N D
Presentation Transcript
NHD Plus as a geospatial framework for drought indicators Jim Verdin
A Digital Watershed connects geospatial and temporal water resources data USGS NWIS Streamflow Digital Watershed NHDPlus NRCS Snotel NOAA ASOS
NHDPlus • An integrated suite of application-ready, geospatial, surface water data products • A national scale integration of • National Hydrography Dataset (NHD) • 1:100,000 • National Elevation Dataset (NED) • 30 meter resolution • Watershed Boundaries Dataset (WBD) • 1:24,000
National Hydrography Dataset • Medium resolution (1:100,000) NHD used in NHDPlus development
National Elevation Dataset • Used snapshot of 1-arcsecond (30 m) NED http://ned.usgs.gov
Watershed Boundary Dataset http://www.ncgc.nrcs.usda.gov/products/ datasets/watershed/
NHDPlus – What’s Inside? • NHD Feature Classes & Tables • Greatly improved 1:100K National Hydrography Dataset • NED Elevation Grids (1-arc-second) • Additional Components: • Stream Network Value Added Attributes (VAA) • Flow Direction and Flow Accumulation Grids • Elevation-based Reach Catchments • Catchment Attributes • mean annual temperature & precipitation from prism • % of each of the 21 land use classes from 1992 NLCD • Streamline Attributes • min/max elevations • slope • mean annual flow estimates • velocity • Cumulative Upstream Area Attributes for Every Grid Cell • Network Locations of USGS Stream Gaging Stations
Network Locations of USGS Stream Gages Gage ID: 09334500 Station Name: White Canyon Near Hanksville, UT Reach Code: 150004001602 Drainage Area: 276 sq. mi. Maximum Flow: 1,370 cfs Average Flow: 5.1 cfs Plus other info from NWIS
Interactive drought index composition • Pick and choose among potential drought index location points • Generate tributary area • Pick and choose among stations and reservoirs in tributary area • Link to CUAHSI HIS observation data for stations and reservoirs • Calculate index and evaluate results • Iterate as desired