Download

1 / 61
610 likes | 871 Vues
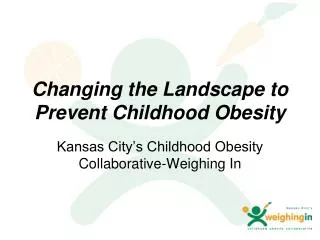
Robert Wood Johnson Foundation Center to Prevent Childhood Obesity. Robert Ping State Network Director Safe Routes to School National Partnership. Robert Wood Johnson Foundation Center to Prevent Childhood Obesity. Goal: reverse childhood obesity in the United States by 2015.

E N D
Robert Wood Johnson Foundation Center to Prevent Childhood Obesity Robert Ping State Network Director Safe Routes to School National Partnership
Robert Wood Johnson Foundation Center to Prevent Childhood Obesity Goal: reverse childhood obesity in the United States by 2015
Robert Ping, State Network Director SRTS National Partnership (Father of Christopher, eating his first donut)
How Bad Has It Become? Percentage of Children who are Obese Aged 10–17 Years by State (1985-2008)
Obesity Trends* Among U.S. AdultsBRFSS, 1985 (*BMI ≥30, or ~ 30 lbs. overweight for 5’ 4” person) No Data <10% 10%–14%
Obesity Trends* Among U.S. AdultsBRFSS, 1986 (*BMI ≥30, or ~ 30 lbs. overweight for 5’ 4” person) No Data <10% 10%–14%
Obesity Trends* Among U.S. AdultsBRFSS, 1987 (*BMI ≥30, or ~ 30 lbs. overweight for 5’ 4” person) No Data <10% 10%–14%
Obesity Trends* Among U.S. AdultsBRFSS, 1988 (*BMI ≥30, or ~ 30 lbs. overweight for 5’ 4” person) No Data <10% 10%–14%
Obesity Trends* Among U.S. AdultsBRFSS, 1989 (*BMI ≥30, or ~ 30 lbs. overweight for 5’ 4” person) No Data <10% 10%–14%
Obesity Trends* Among U.S. AdultsBRFSS, 1990 (*BMI ≥30, or ~ 30 lbs. overweight for 5’ 4” person) No Data <10% 10%–14%
Obesity Trends* Among U.S. AdultsBRFSS, 1991 (*BMI ≥30, or ~ 30 lbs. overweight for 5’ 4” person) No Data <10% 10%–14% 15%–19%
Obesity Trends* Among U.S. AdultsBRFSS, 1992 (*BMI ≥30, or ~ 30 lbs. overweight for 5’ 4” person) No Data <10% 10%–14% 15%–19%
Obesity Trends* Among U.S. AdultsBRFSS, 1993 (*BMI ≥30, or ~ 30 lbs. overweight for 5’ 4” person) No Data <10% 10%–14% 15%–19%
Obesity Trends* Among U.S. AdultsBRFSS, 1994 (*BMI ≥30, or ~ 30 lbs. overweight for 5’ 4” person) No Data <10% 10%–14% 15%–19%
Obesity Trends* Among U.S. AdultsBRFSS, 1995 (*BMI ≥30, or ~ 30 lbs. overweight for 5’ 4” person) No Data <10% 10%–14% 15%–19%
Obesity Trends* Among U.S. AdultsBRFSS, 1996 (*BMI ≥30, or ~ 30 lbs. overweight for 5’ 4” person) No Data <10% 10%–14% 15%–19%
Obesity Trends* Among U.S. AdultsBRFSS, 1997 (*BMI ≥30, or ~ 30 lbs. overweight for 5’ 4” person) No Data <10% 10%–14% 15%–19% ≥20%
Obesity Trends* Among U.S. AdultsBRFSS, 1998 (*BMI ≥30, or ~ 30 lbs. overweight for 5’ 4” person) No Data <10% 10%–14% 15%–19% ≥20%
Obesity Trends* Among U.S. AdultsBRFSS, 1999 (*BMI ≥30, or ~ 30 lbs. overweight for 5’ 4” person) No Data <10% 10%–14% 15%–19% ≥20%
Obesity Trends* Among U.S. AdultsBRFSS, 2000 (*BMI ≥30, or ~ 30 lbs. overweight for 5’ 4” person) No Data <10% 10%–14% 15%–19% ≥20%
Obesity Trends* Among U.S. AdultsBRFSS, 2001 (*BMI ≥30, or ~ 30 lbs. overweight for 5’ 4” person) No Data <10% 10%–14% 15%–19% 20%–24% ≥25%
Obesity Trends* Among U.S. AdultsBRFSS, 2002 (*BMI ≥30, or ~ 30 lbs. overweight for 5’ 4” person) No Data <10% 10%–14% 15%–19% 20%–24% ≥25%
Obesity Trends* Among U.S. AdultsBRFSS, 2003 (*BMI ≥30, or ~ 30 lbs. overweight for 5’ 4” person) No Data <10% 10%–14% 15%–19% 20%–24% ≥25%
Obesity Trends* Among U.S. AdultsBRFSS, 2004 (*BMI ≥30, or ~ 30 lbs. overweight for 5’ 4” person) No Data <10% 10%–14% 15%–19% 20%–24% ≥25%
Obesity Trends* Among U.S. AdultsBRFSS, 2005 (*BMI ≥30, or ~ 30 lbs. overweight for 5’ 4” person) No Data <10% 10%–14% 15%–19% 20%–24% 25%–29% ≥30%
Obesity Trends* Among U.S. AdultsBRFSS, 2006 (*BMI ≥30, or ~ 30 lbs. overweight for 5’ 4” person) No Data <10% 10%–14% 15%–19% 20%–24% 25%–29% ≥30%
Obesity Trends* Among U.S. AdultsBRFSS, 2007 (*BMI ≥30, or ~ 30 lbs. overweight for 5’ 4” person) No Data <10% 10%–14% 15%–19% 20%–24% 25%–29% ≥30%
Obesity Trends* Among U.S. AdultsBRFSS, 2008 (*BMI ≥30, or ~ 30 lbs. overweight for 5’ 4” person) No Data <10% 10%–14% 15%–19% 20%–24% 25%–29% ≥30%
Factors Linked to Creating Energy Imbalance • Food Environment • Built Environment • Transportation • Parks • Safety • Education and the School Setting
Energy Balance Framework of the RWJF Center • Increasing children’s consumption of healthy foods and beverages and decreasing consumption of unhealthy alternatives • Increasing physical activity • Building awareness and support
Robert Wood Johnson Foundation Center to Prevent Childhood Obesity • Established in September 2008 • Harness the impact of the RWJF programs and affiliated resources • Advance a comprehensive policy agenda at the federal, state, and local levels
Goals of the RWJF Center • Reduce overweight and obesity among children in the U.S. • Decrease disparities • Communities of color • Impoverished areas • Disproportionately affected regions • Create systemic, sustainable changes
Obesity is Not Simply a Health Issue • Policy change and collaboration among various disciplines • Transportation • Education • Built Environment • Parks and Recreation • Nutrition • Food Marketing • Agriculture • and others
RWJF Center Areas of Work • Technical assistance to build capacity and leadership of the movement • Policy agendas at the national, state, regional, and local levels • Advance communications and media strategies • Synthesize evidence-based science
ACTION ADVOCACY EVIDENCE RWJFStrategies/Programs Alliance for a Healthier Generation: Healthy Schools Program Healthy Kids, Healthy America Healthy Kids, Healthy Communities New Jersey Partnership for Healthy Kids Safe Routes to School National Partnership: State Network Project Pioneering Healthier Communities: YMCA of the USA Communities Creating Healthy Environments Faith-Based Advocacy: Galvanizing Communities to End Childhood Obesity Leadership for Healthy Communities Mobilizing Health Care Professionals as Community Leaders in the Fight Against Childhood Obesity National Policy and Legal Analysis Network to Prevent Childhood Obesity Campaign for Healthy Kids: Save the Children Active Living Research African American Collaborative Obesity Research Network (AACORN) Bridging the Gap Food Marketing and Youth Project at Yale University Rudd Center Healthy Eating Research Salud America! National Collaborative on Childhood Obesity Research (NCCOR) RWJF Center to Prevent Childhood Obesity IOM Standing Committee Convergence Partnership
Policy Priorities for Energy Balance • Federal • State • Local
Federal Policy Opportunities • Child Nutrition and WIC • Transportation Reauthorization • K–12 Education, Reauthorization of Elementary and Secondary Reauthorization Act • Federal Trade Commission and Food Marketing
State Policy Opportunities Safe Routes to School Legislation Wellness Policies School Siting Complete Streets Personal Safety Many others…
Safe Routes to School State Network Project: 2007-2011 Making Change Through Partners and Policies
2010 STATE NETWORK PROJECT PARTICIPATING STATES
Why Safe Routes to School? Distance - Traffic Safety - Fear of Crime
School consolidation has lengthened the trip between home and school • From 1968-2001 - 1,000 less schools; 2 million more students • Only 35% of students live within 2 miles of their school (CDC 2005 Kidswalk-to-School)
Local Government Actions - Nutrition • Promote the use of healthy foods and beverages for local government-sponsored events. • Limit marketing of unhealthy foods where children gather. • Promote healthy foods in government buildings and community property • Require fast-food/chains to include calories on in-store menus and menu boards. • Incentives for restaurants offering healthier menu items.
Local Government Actions - Nutrition Create incentive programs for retail grocery stores in underserved areas, Improve food offerings in corner and convenience stores, Start and sustain farmers’ markets. Community groups/farmers technology to accept Electronic Benefit Transfer, debit and credit purchases at farmers’ markets, etc..
Local Government Actions - Physical Activity Connect roadways to trails and bike paths. Support smart growth strategies and zoning: compact and mixed-use zoning, affordable housing, thriving retail, transit-oriented development, urban infill, walkable and bikable street design, green building practices.